Key Takeaways
At the beginning the COVID-19 pandemic, the criminal justice system was affected by public health measures such as the statewide shelter-in-place order, as well as state and local directives that altered interactions between law enforcement officers and the public, resulted in the early release of inmates, and modified bail procedures. This report takes a first step toward investigating California arrest trends during this period (through mid-2021). Like the rest of the nation, California experienced overall decreases in crime in 2020, likely due to fewer people leaving their homes, but there were increases in some crime categories, including homicides. The causes of the trends we have identified are hard to discern, given the highly unusual and challenging context of the pandemic.
- Arrests began to fall precipitously in early March 2020, driven by reductions in misdemeanor arrests. Felony arrests briefly experienced significant declines but rose to around 10 percent below January 2020 levels by fall 2020. Though some COVID-related criminal justice policies and measures expired after a few months, California experienced persistent declines of 5 percent for felony arrests and 40 percent for misdemeanor arrests until at least July 2021—resulting in a rare near-convergence of these two arrest types. The reductions were largely among lower-level offenses related to drugs and driving. →
- Californians staying home appeared to be a key driver of arrest trends during 2020, through reduced social interactions and police-public encounters. Changes in the number of people walking, driving, and using transit are consistent with initial decreases and subsequent rebounds in arrests during this period. The mobility-arrest relationship was not as close in 2021, when arrests did not fluctuate as much. →
- In general, percent changes in arrests were similar across racial/ethnic groups. After the murder of George Floyd, there were 9 to 15 percent more misdemeanor arrests across all races compared to the preceding weeks. However, felony arrests of Black Californians spiked by 43 percent during this period—relative to increases of less than 10 percent for other races. →
- Reductions in police stops and formal enforcement also contributed to declines in arrests. The state’s largest local law enforcement agencies made 35 percent fewer stops until at least the end of 2020. They also altered their handling of the stops they did make: officers were proportionally more likely to let people go without formal enforcement in the first few months of the pandemic, and later transitioned to citing and releasing stopped individuals in the field. →
- Pandemic policies raised concerns about a “revolving door” effect—whereby people are repeatedly detained and released. Re-arrests as a proportion of arrests are a key indicator of this effect. In the months before COVID, about 40 percent of weekly arrests were re-arrests within a 90-day period; after holding steady during much of the pandemic, this share dropped sharply to 32 percent in June 2021. However, the felony re-arrest share increased from 29 percent to 32 percent before the June 2021 decline. Further study of re-arrests in relation to specific policies is warranted. →
- Declines in arrests contributed to a 30 percent reduction in new admissions into jail and a 17 percent reduction in the jail population that persisted until at least December 2021. While it is clear that multiple factors contributed to a sustained decline in bookings and jail populations, the impact of any one policy is difficult to quantify. →
Introduction
COVID-19 presented unprecedented public health challenges, resulting in numerous local and state policies and directives—including those within the criminal justice system—aimed at reducing the spread of the deadly virus. These efforts included a statewide shelter-in-place order and many county-level mandates to stay at home. During the initial months of the COVID-19 pandemic, law enforcement officers were directed to modify their interactions with community members to limit potential exposure, and to avoid arrests and bookings when possible to reduce the number of people entering county jails. In addition, some inmates were released early from jails and prisons. Zero-bail orders, which set bail at zero dollars for most misdemeanors and lower-level felonies—as well as a handful of more serious felonies—were issued in late March and early April 2020 by a few county superior courts, before the Judicial Council of California issued a statewide emergency zero-bail order in mid-April (Slough et al. 2020).
Like the rest of the nation, California experienced overall decreases in property and violent crime—driven by declines in robbery, burglary, and larceny—during 2020. However, there were upticks in some categories, including homicides, aggravated assault, and auto thefts, and concerns around crime broadly intensified (Lofstrom and Martin 2021; Bonner 2022). The causes of these trends are hard to discern, given the highly unusual and challenging context of the pandemic.
This report provides an overview of arrest trends as well as how arrests were handled during the COVID-19 pandemic (e.g., being cited and released vs. booked into jail). It also highlights key events and policies that may have had an impact. To better understand factors driving arrests during the pandemic, we examine whether the timing and/or location of policy implementation and major social events coincided with changes in arrest patterns. Importantly, this report does not establish causal links between specific policies and changes in arrest trends. It provides an overview of trends in arrests and discusses the pandemic-era factors influencing arrests that should be more definitively explored in future research.
Trends in Arrests and Bookings during the Pandemic
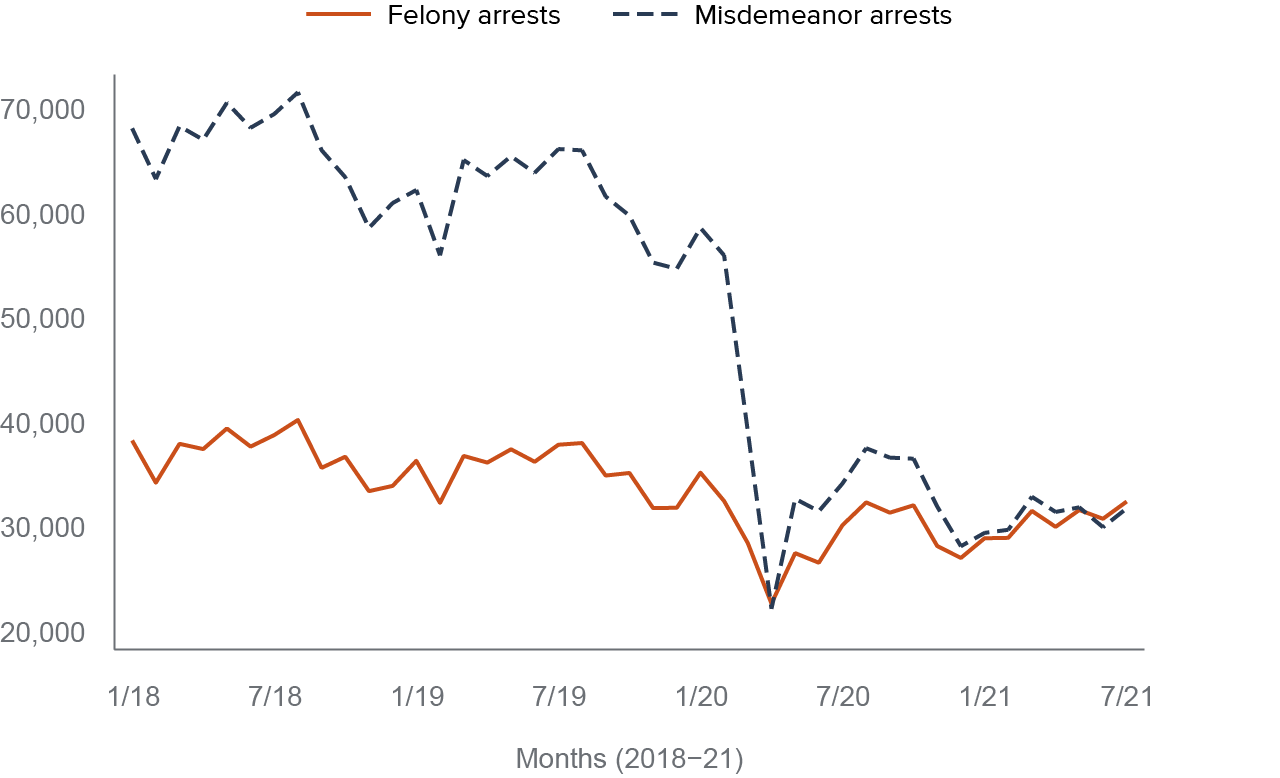
The number of arrests fell precipitously in early 2020 in California, driven largely by misdemeanor arrests (Figure 1). Misdemeanor arrests declined moderately from January 2018 to February 2020, while felony arrests remained stable. As COVID-19 concerns deepened in March 2020, arrests plunged sharply. From March 2020 to July 2021, the end of the reporting period, there were just 32,100 misdemeanor arrests and 29,400 felony arrests per month, compared to an average of 63,500 and 36,100 from January 2018 to February 2020. From April to August 2020, misdemeanor arrests temporarily drifted upward, while felony arrests rose more moderately. Misdemeanor arrests typically outnumber felony arrests by a wide margin, so the near-convergence of felony and misdemeanor arrests at various points between March 2020 and July 2021 (the end of the data sample) is quite striking.
Arrests plunged in early March 2020
SOURCE: California Department of Justice: Automated Criminal History System (ACHS) data.
NOTE: The figure presents arrest trends in monthly counts from January 2018 to July 2021.
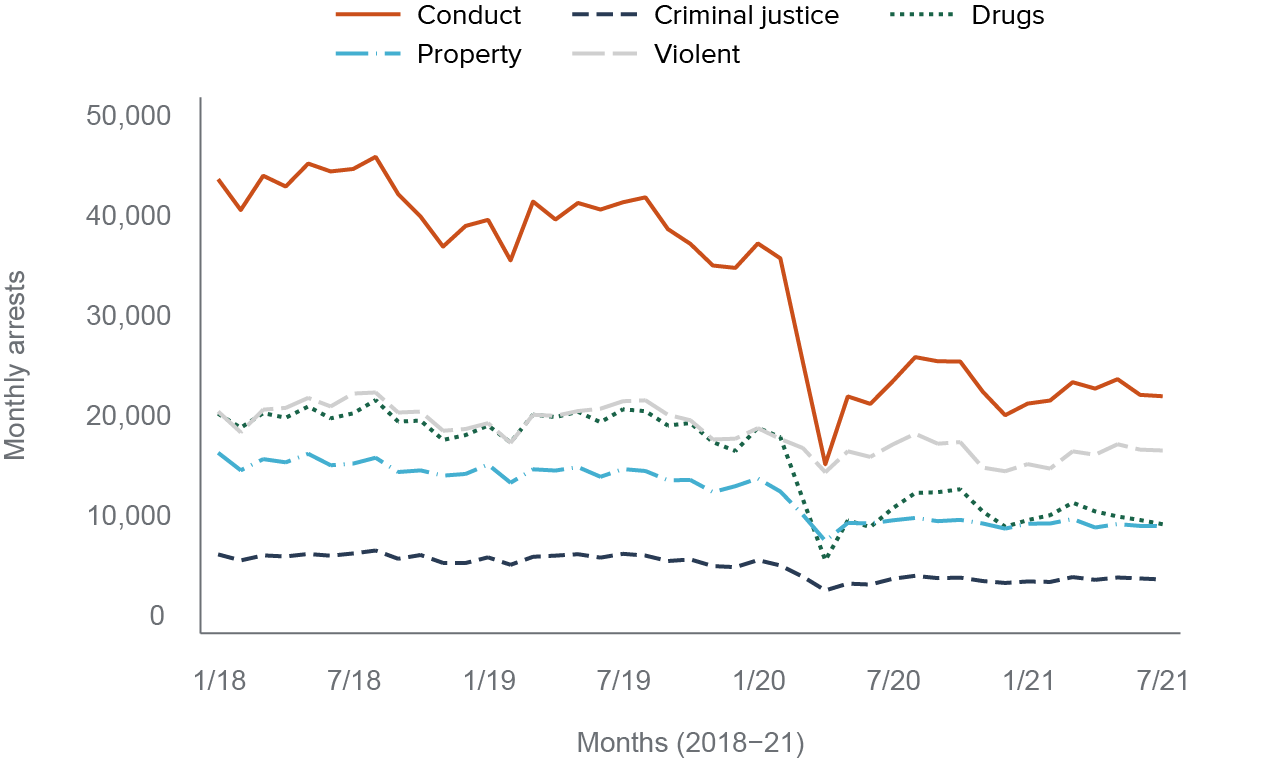
Arrests fell across all crime categories, largely driven by conduct and drug arrests; arrests for violent crimes fell the least in percentage terms (Figure 2). The first phase of the pandemic (March 2020–July 2021) saw the average number of monthly arrests for violent crimes decline by 19 percent relative to the pre-pandemic months from 2018 to 2020. Meanwhile, monthly arrests for property crime offenses were on average 36 percent lower, arrests for criminal justice system violations (e.g., violations of court orders, parole, or probation) were 39 percent lower, and arrests for drug crimes were 47 percent lower on average. Finally, monthly arrests for conduct crimes were on average 44 percent lower than the same month the prior year. During the pandemic era, there were about 17,800 fewer monthly arrests for conduct crimes than two years beforehand, with monthly arrests for drug crimes falling by about 9,100 on average. Decreases in conduct and drug arrests collectively accounted for 71 percent of the drop in arrests during this period.
Conduct and drug crimes account for most of the decline in arrests
SOURCE: California Department of Justice: Automated Criminal History System (ACHS) data.
Re-arrest Patterns Were Similar to Arrest Trends
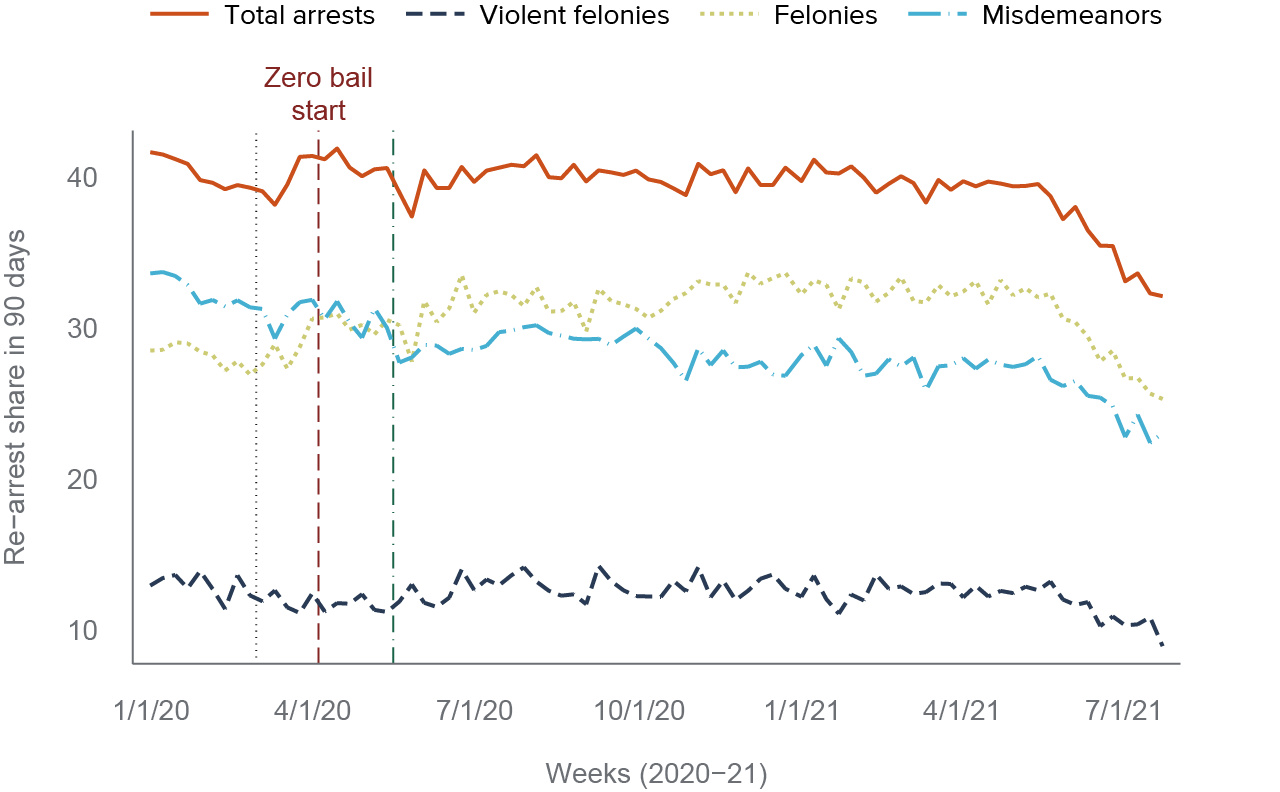
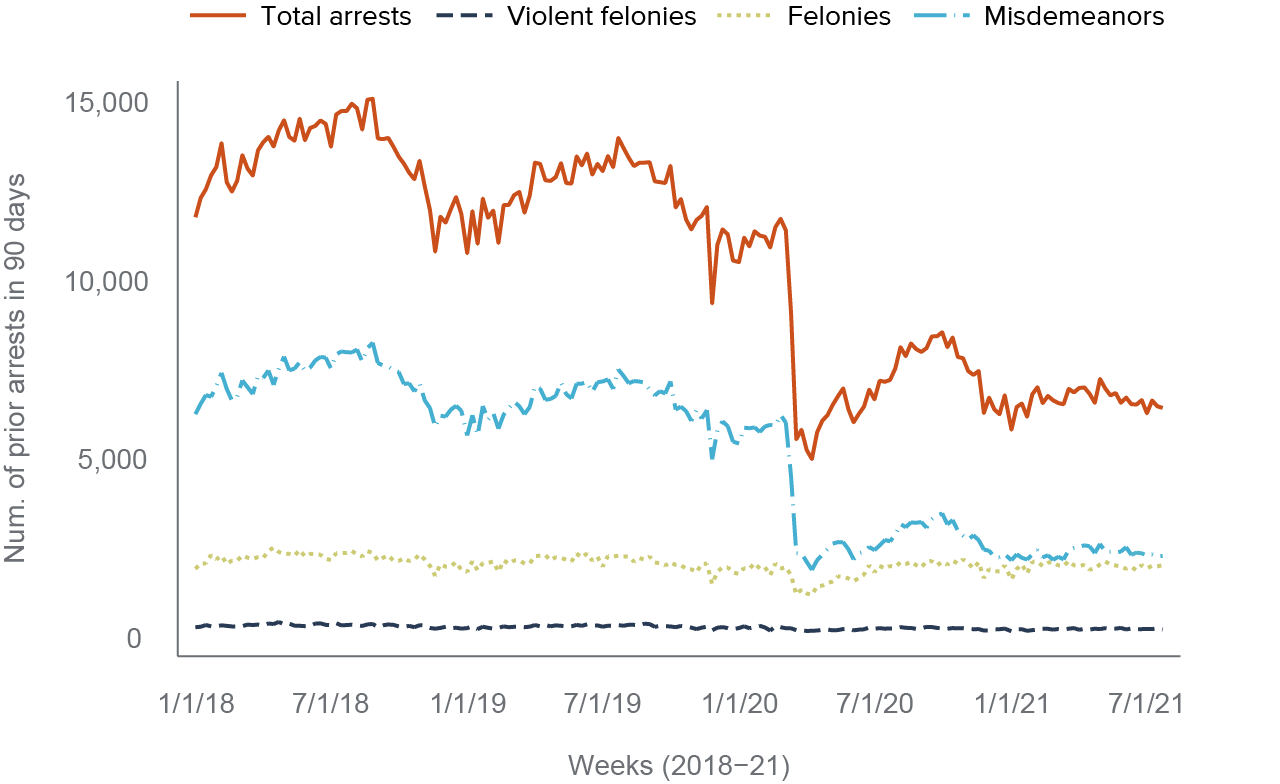
When the pandemic caused changes in criminal justice policies, people raised the concern that the policy shift may result in people repeatedly shuffling in and out of detention (Rynor 2021; Rynor 2022). To explore trends in re-arrests, we examined whether those who were arrested between 2018 and 2021 had been arrested previously. Of the 1.5 million Californians who were arrested from 2018 to 2021, individuals were re-arrested 2.28 times on average. When we look at re-arrests that occurred within 90 days of an initial arrest, this average falls to about one. A substantial portion of 90-day re-arrests involve an original and subsequent misdemeanor arrest (0.47), while two violent felony arrests (0.04) are rare. As shown in Figure 3, the weekly number of re-arrests over a 90-day period dipped significantly in the initial months of COVID, transitioning from around 12,800 in the pre-COVID period to 7,000 after. This steep decline is reflective of reductions in misdemeanor re-arrests, which fell from 6,800 to 2,700, while felony re-arrests declined less sharply, from about 2,200 to 1,900. These persistent drops in re-arrests are similar to reductions observed in overall arrests (Figure 1).
The number of re-arrests within 90 days decreased significantly from 2018 to 2021
SOURCE: California Department of Justice: Automated Criminal History System (ACHS) data.
NOTES: The figure shows weekly counts of re-arrest within 90 days by severity of offense (January 2018–July 2021). All categories of re-arrest involve initial and subsequent arrests for crimes at the same level of severity.
Jail Bookings and Populations Dropped Early in the Pandemic
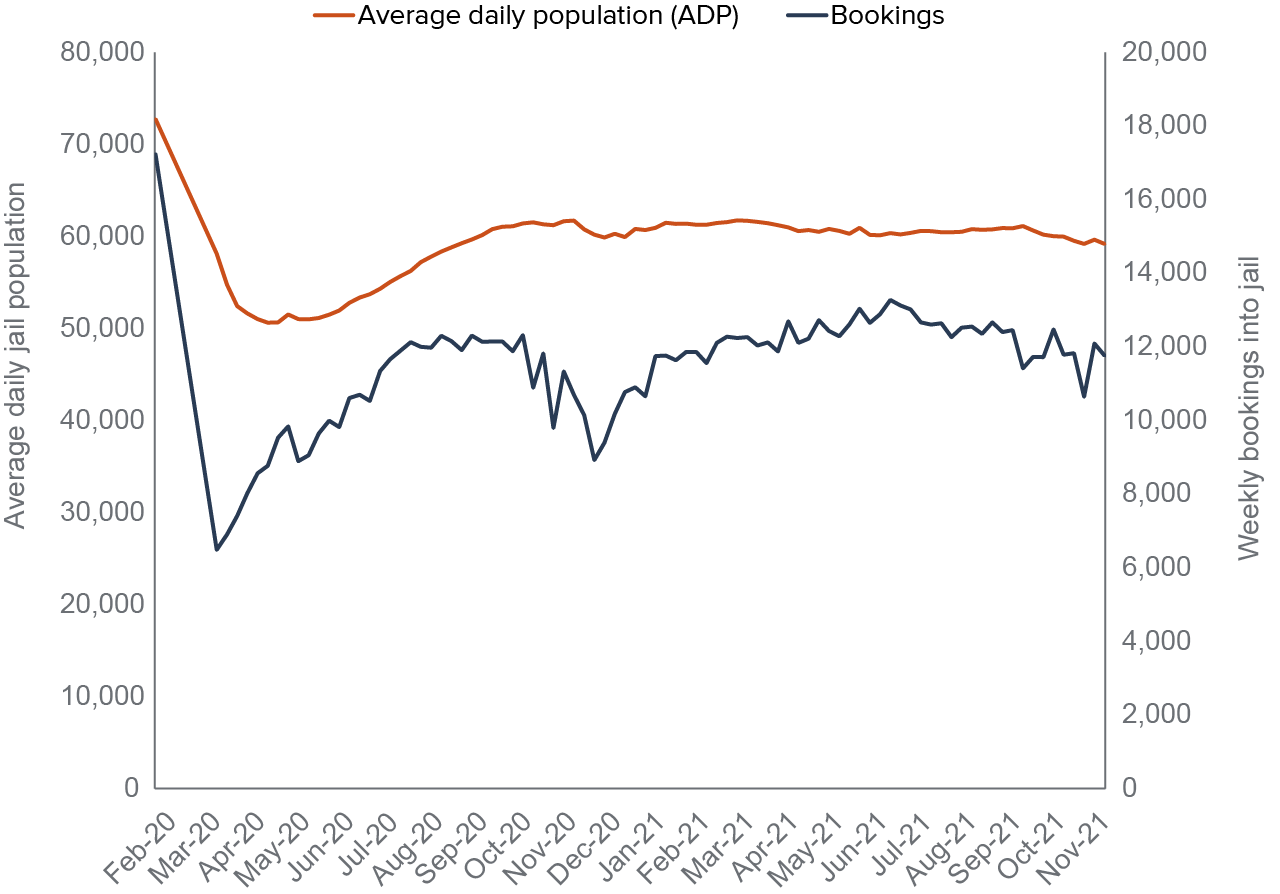
At the beginning of the pandemic, a COVID-induced dip in arrests substantially impacted jail booking rates in California, which contributed to a sharp drop in the state’s total jail population during the first two months of the pandemic.
Figure 4 shows the dramatic drop in weekly bookings into county jails. Bookings dropped from about 17,000 per week in late February 2020 to a low of about 6,500 in April 2020, and then drifted up to about 12,000 in the summer of 2020. After another dip in late 2020, weekly jail bookings hovered around 12,000 starting in March 2021, a drop of roughly 30 percent compared to February 2020.
County sheriffs and state prison officials also adapted by releasing inmates early (see Technical Appendix Table A1 for examples). As shown in Figure 4, the statewide average daily jail population (ADP) dropped from 72,000 in February 2020 to 68,000 by the end of March. The ADP decreased further by the end of April, to 51,000. The population then slowly drifted upward to roughly 59,000 in September (Harris and Hayes 2021), where it stayed through December 2021. California also saw significant reductions in the institutional prison population, which declined from around 117,300 inmates in February 2020 to a low point of 91,000 in January 2021 (CDCR 2020a; CDCR 2021)—a drop that is comparable to the reduction after California’s public safety realignment in 2011 (Raphael and Lofstrom 2015). Afterward, the prison population slightly edged upward to 96,500 in December 2021 (CDCR 2022), but it has been persistently low enough to prompt discussions of prison closures (Ahumada 2022).
Jail bookings and populations dropped dramatically in March 2020 and remained below February 2020 levels
SOURCE: Average Daily Population and Weekly Bookings in California Jails, February 2020–December 2021, California Board of State and Community Corrections.
Exploring Factors Contributing to Arrest Trends during the Pandemic
In the early months of the COVID-19 pandemic, Californians’ lives were transformed by measures that were instituted to reduce virus transmission, including a statewide shelter-in-place order (Technical Appendix Table A1). These measures halted regular work, travel, entertainment, and socializing patterns. Within the criminal justice system, local law enforcement agencies issued directives to avoid unnecessary contact with the public. They also mandated “cite-and-release” orders to non-custodial arrest suspects for some offenses (i.e., issue summons to court rather than booking them into jail). Local courts and the Judicial Council issued zero-bail orders. Most courts closed temporarily, and many reopened with remote hearings (Harris, forthcoming). County jails and state prisons released many inmates early. In this section, we examine how some notable pandemic-related changes may have directly and indirectly affected arrests.
COVID-era Policies and Events that May Have Affected Arrest Trends
Sheltering in place
As concerns and confirmed cases of COVID began to grow in late February and early March, Governor Gavin Newsom declared a state of emergency on March 4. During this period, there were a myriad of local orders, warnings, and shifts in workplace policies intended to limit movement and reduce contact. On March 16, the Bay Area counties issued a shelter-in-place order, which was quickly followed by a statewide shelter-in-place order on March 19. These factors resulted in Californians starkly decreasing their public mobility. By April 15, California residents were taking 50 percent fewer trips to work, retail shops, and restaurants, and 20 percent fewer trips to grocery stores than they had in the previous month (Phillip 2021). Californians sheltering in place on a massive scale in the spring of 2020 led to fewer social interactions and possibly reduced some crimes such as larceny, residential burglary, and robbery (Scott and Gross 2021). These factors likely resulted in fewer arrests. As restrictions eased and people increased their public movement starting in late April, it is likely that there were corresponding increases in arrests.
From late October 2020 to January 2021, COVID hospitalizations and deaths then peaked. This surge prompted statewide curfews and closings of non-essential businesses in mid-November, followed by Los Angeles County and five Bay Area counties issuing shelter-in-place orders in late November/early December. As a result, there was another round of reductions in movement, especially walking and driving. With fewer people leaving their homes, there were fewer occasions for interaction between law enforcement and people out in public, and fewer crimes (Abrams 2021; Abrams, Fang, and Goonetilleke 2022). These decreases in crime and police-public interactions contributed to declines in arrests and bookings.
Emergency law enforcement policies
By mid to late March 2020, some California law enforcement agencies had already begun to reduce interactions with community members—to protect both officers and the public from COVID-19. In addition, agencies began directing officers to avoid arrests and bookings wherever possible to reduce the number of people entering crowded jail settings (Figueroa and Kucher 2020; Gumbs and Hayes 2020; LASD 2020). These efforts likely reduced arrest levels.
Many county jails were filled beyond capacity, and law enforcement agencies hoped to prevent COVID-19 from spreading quickly to inmates and staff in densely packed detention settings and into communities (Technical Appendix Table A1). Some large agencies reduced jail populations by releasing inmates early. For instance, by March 24, jails in Los Angeles County had released 1,700 inmates who were within 30 days of the end of their sentences or were being held for relatively low-level offenses (Hamilton 2020). The impact these early releases had on arrest rates is unclear.
Zero-bail policies
The Judicial Council of California passed several emergency measures, including a zero-bail policy intended to reduce the flow of individuals booked into county jails and limit the number of individuals held in jail for pretrial detention (Slough et al. 2020). By reducing bail to zero for a broad range of offenses, the Judicial Council’s zero-bail policy meaningfully altered the existing pretrial detention process in California.
The statewide zero-bail emergency order, in place from April 13, 2020 to June 20, 2020, set bail for most misdemeanors and lower-level felonies—and a handful of more serious felonies—at zero dollars. Most serious, sexual, and violent crimes, including domestic violence, some assault and weapons offenses, and driving under the influence were excluded from the zero-bail policy (California Courts 2020)—but it covered a handful of more serious and violent felonies, including some assaults that cause serious bodily injury. Individuals arrested for zero-bail offenses were released immediately after they were booked into jail, unless law enforcement or the district attorney petitioned a judge to set a different bail amount in the interest of public safety.
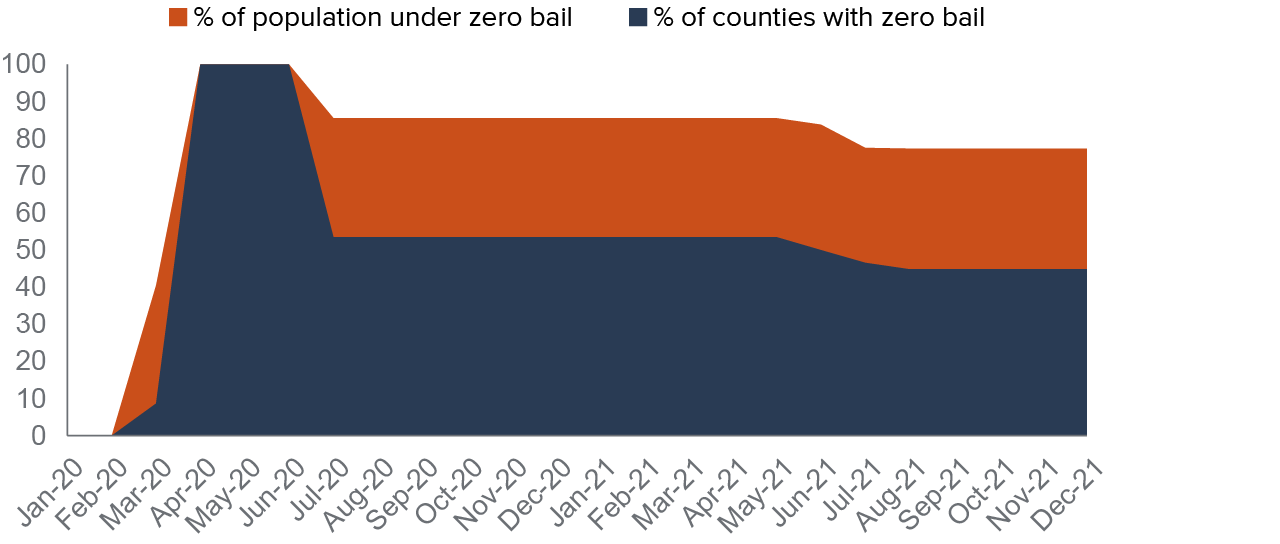
After the statewide policy expired on June 20, 2020, the Judicial Council granted county superior courts the authority to continue zero bail (Balassone 2020a). At that time, 31 county superior courts representing 86 percent of the state’s population chose to continue to use zero-bail schedules (Balassone 2020b), as demonstrated by Figure 5. Some of these counties modified the statewide order—for example, counties such as Los Angeles disqualified individuals from being released on zero bail if they were arrested while still on a zero-bail release for a different offense (Los Angeles Superior Court 2020). By December 2021, five of those counties had ceased to use zero-bail schedules, leaving 77 percent of the state’s population in counties with zero bail (California Courts 2021).
Although less than half of counties had zero bail through December 2021, the policy affected most of California’s population
SOURCE: California county superior courts, Judicial Council of California.
NOTE: This figure only shows county superior court zero-bail policies, excluding any policies instituted by district attorneys.
These numbers exclude San Francisco County because its superior court did not continue the zero-bail order in June 2020. However, the district attorney continued the county’s pre-pandemic policy of not seeking cash bail as a condition of pre-trial release. Counties that discontinued the use of zero bail in 2020 and 2021 reverted to monetary bail. Further explanation of zero bail’s potential effects on arrests can be found in Technical Appendix A.
Civil unrest in the wake of the murder of George Floyd
The state’s criminal justice system was affected by mass protests and demonstrations in late May and early June of 2020, after the murder of George Floyd by a Minneapolis Police Department officer. The protests have been described as the largest demonstrations in US history, and confidence in the police fell to historical lows across the country (Brenan 2020; Buchanan, Bui, and Patel 2020; Bonner 2022). Law enforcement responses to these protests may also have affected arrests.
The dynamic between police and the public typically changes in the aftermath of high-profile police killings. Police in the involved department significantly reduce the number of arrests made, particularly for low-level offenses, and these jurisdictions also experience increases in violent crime (Premkumar 2019). The highest-profile police killings can also have spillover effects in other municipalities, particularly those are that are predominantly Black (Cheng and Long 2022). After George Floyd’s murder, community reporting of crime decreased significantly across the country (Ang et al. 2021), as did police-public interactions (Abrams, Fang, and Goonetilleke 2022). It is likely that these combined factors suppress overall arrest levels, particularly for misdemeanor or low-level offenses, while arrests for more serious felonies or violent crimes may hold steady or even show increases, given the observed increases in violent crime mentioned above (Premkumar 2019). Research on the George Floyd killing suggests that this event may have affected arrests in jurisdictions across the country. This adds another major factor to the mix of pandemic-era changes that influenced arrest trends in California.
Analysis of Key Events and Trends
We find that the major events of 2020 clearly shaped arrest trends: initially empty streets led to plummeting arrests, which temporarily spiked amid street protests. By contrast, the impact of criminal justice policies is difficult to discern.
Timing of COVID responses and changes in arrests
To examine changes in arrests during the pandemic (January 2020–July 2021), we plot the percent change in weekly arrests relative to the first week of January 2020 by level of offense (misdemeanor or felony) and by race/ethnicity.
Misdemeanor arrests
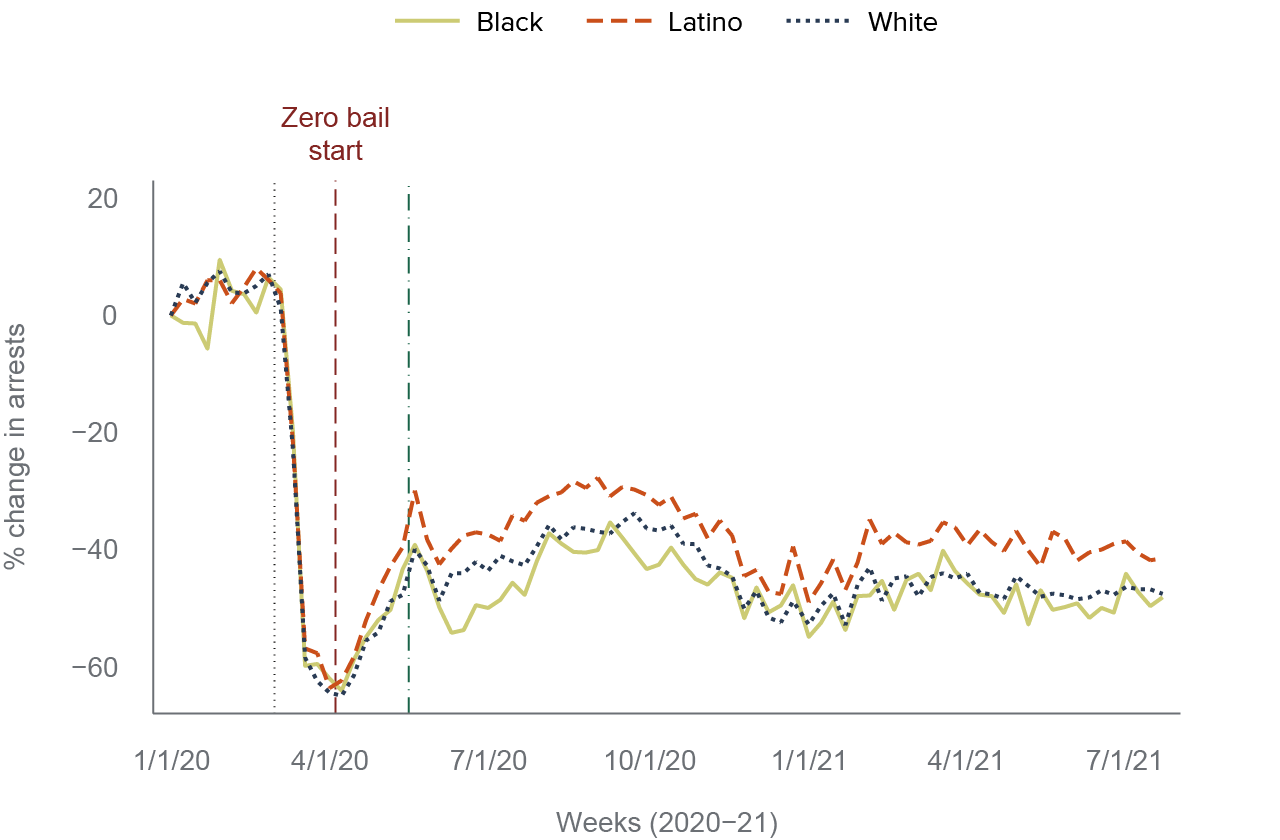
Figure 6 shows the weekly percent changes in misdemeanor arrests across most major racial/ethnic groups. Governor Newsom’s state of emergency declaration on March 4, 2020, is denoted by a dotted gray line. After this declaration, COVID-19 officially became a significant statewide public health concern, which induced voluntary changes in public movement and subsequent reductions in arrests. (For a more detailed timeline, see Technical Appendix Table A1.) We can see that the major reductions preceded the zero-bail order, some local criminal justice directives, and even shelter-in-place (SIP) orders, making the impact of these policies harder to discern. On April 13, 2020, the Judicial Council implemented a statewide zero-bail emergency measure (denoted by the red dashed line in center). Finally, the green dashed line (right) delineates the murder of George Floyd on May 25, which was followed by civil unrest and possibly also changes in arrest patterns across the state (Premkumar 2019; Abrams, Fang, and Goonetilleke 2022; Cheng and Long 2022).
Misdemeanor arrests dropped as much as 60 percent in 2020
SOURCE: California Department of Justice: Automated Criminal History System (ACHS) data.
NOTES: The figure presents misdemeanor arrest trends by race from January 2020 to July 2021, in weekly percent changes relative to January 1, 2020. Asians are not shown because the number of Asians arrested is relatively low, which means that percent changes exhibit far more variation. (Technical Appendix Figure A1 does include Asians.) The dotted gray line marks the date just before Governor Newsom declared a state of emergency (on March 4). On March 16, Bay Area counties instituted a shelter-in-place order. The red dashed line is just before the Judicial Council instituted a statewide zero-bail policy (April 13). The green dashed line is just before the murder of George Floyd (May 25).
In early March, misdemeanor arrests begin to fall sharply. After declining 60 percent by early April, misdemeanor arrests crept upward but mostly remained 40–50 percent lower (relative to January 2020) until July 2021, with two exceptions: First, in late May, amid protests over the murder of George Floyd (which coincided with Memorial Day weekend), there was a one-week jump of 4 to 10 percentage points. Second, from late October 2020 to January 2021, misdemeanor arrests dropped 12 to 16 percentage points across racial/ethnic groups, as people moved less during a severe COVID surge.
Evidence from California and across the country indicates that reductions in crime as well as drops in police-public interactions (Abrams 2021; Abrams, Fang, and Goonetilleke 2022) drove reductions in arrests before shelter-in-place policies were introduced. It is likely that public concern about the spread of COVID-19 caused people to stay inside even before SIP orders, significantly reducing both crime and arrests.
On average, Black Californians experienced more pronounced drops in misdemeanor arrests than Latino and white Californians. Still, the declines are quite consistent across groups, suggesting a broader pullback of arrest activity (see Technical Appendix Figures A5 and A6 for racial disparity in arrest rates over time). Misdemeanor arrests of Asians exhibited a similar pattern, but they are far more variable because the number is relatively low, rendering interpretation of patterns at the weekly level unreliable (see Technical Appendix Figure A1 for more information).
Felony arrests
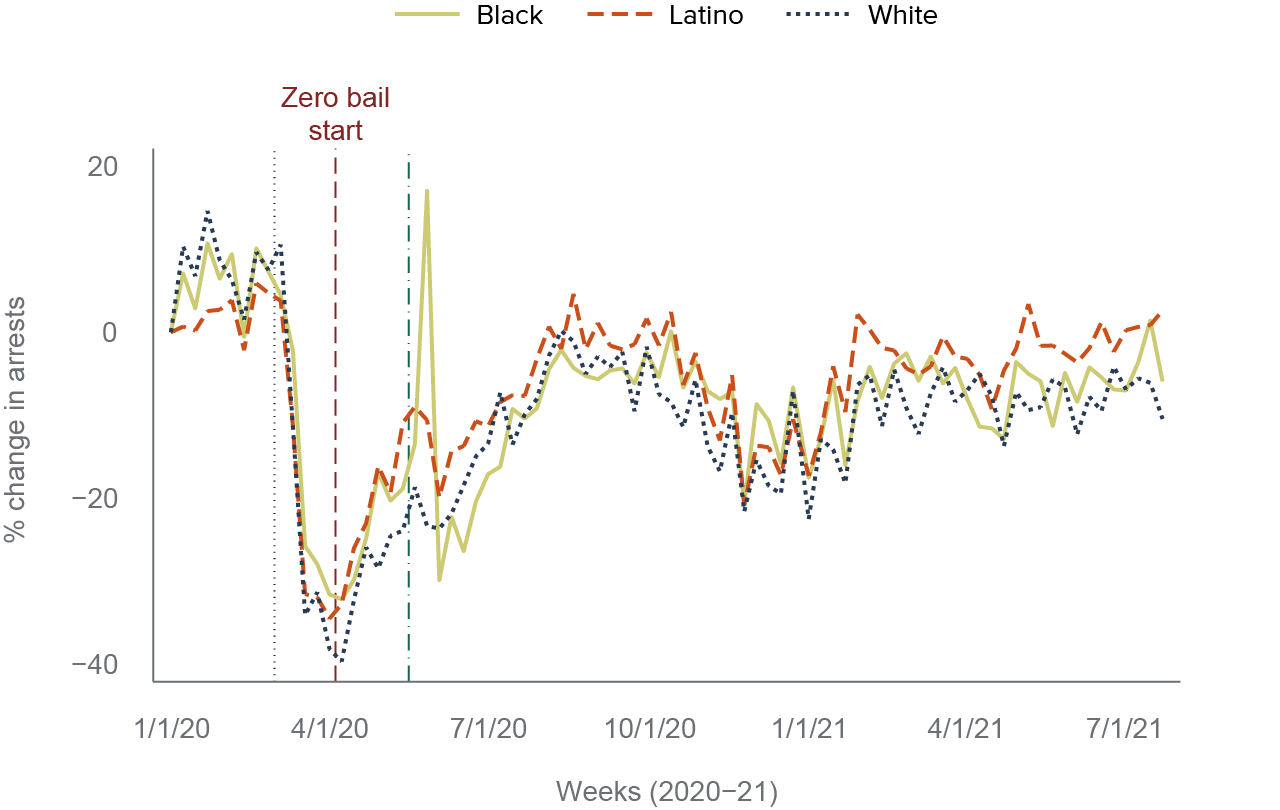
California saw similar—though smaller—changes in felony arrests during this period. Figure 7 shows that felony arrests began to fall in early March, falling 40 percent by early April. Felony arrests then began to rise, and there was a substantial but temporary spike after the murder of George Floyd.
Felony arrests dropped sharply in March 2020 but rebounded quickly
SOURCE: California Department of Justice: Automated Criminal History System (ACHS) data
NOTE: The figure shows felony arrest trends by race from January 2020 to July 2021, in weekly percent changes relative to January 1, 2020. Asians are excluded because their relatively low involvement in arrests makes percent changes far more pronounced. (Technical Appendix Figure A2 includes Asians.) The dotted gray line marks the date just before Governor Newsom declared a state of emergency (on March 4). On March 16, Bay Area counties instituted a shelter-in-place order. The red dashed line is just before the Judicial Council instituted a statewide zero-bail policy (April 13). The green dashed line is just before the murder of George Floyd (May 25).
This temporary rise in felony arrests occurred across racial/ethnic groups. However, arrests of African Americans increased 35 percentage points during the week after the murder, relative to the week before. Put differently, felony arrests of African Americans briefly spiked by 44 percent—compared to increases of about 2 to 7 percent for other races. In fact, there were an equal number of felony arrests of Black and white individuals, even though Black individuals make up only 5 percent of the California population and whites comprise 35 percent (Technical Appendix Figure A4; Johnson, McGhee, Cuellar Mejia 2022). However, this jump in felony arrests dissipated by June, returning to mid-May levels (reductions of about 20%).
Felony arrests increased gradually until August 2020, plateauing at their January levels until about October 2020. From October 2020 to February 2021, felony arrests experienced a significant decline during the winter COVID surge and then a partial rebound. Following this, felony arrests remained around 5 percent lower relative to January 2020. These results are consistent across race, with the exception of the temporary spike after the murder of George Floyd.
As we have seen, misdemeanor arrests dropped more markedly than felony arrests, and felony arrests spiked more dramatically following the murder of George Floyd. These reductions were concentrated in arrests for conduct and drug crimes—typically, these are less severe offenses for which an officer may have more discretion in enforcement (Figure 2). These arrest categories experienced the largest percent declines, while the smallest declines were in arrests for violent crime (Technical Appendix Figure A7). Arrests for property offenses sharply rose by 36.5 percent in the week after the murder of George Floyd, followed by increases of 14 to 16 percent in arrests for conduct and drug crimes (Technical Appendix Figure A7).
Changes in arrests were closely associated with public movement
In this section, we examine changes to mobility in relation to arrest patterns. While many people voluntarily restricted their public movements in response to COVID concerns, California counties imposed some of the country’s first shelter-in-place orders, which purposefully restricted mobility and social gathering. Fewer people out in public meant fewer potential victims and perpetrators, which reduced arrest levels. Also, as fewer Californians left their homes, police-public interactions decreased, resulting in fewer arrests as well.
To examine public movement, we use location data from requests to Apple Maps. Each data point includes the county in which the request for navigation directions was made, the type of transportation selected by the user, and the date of each request. Figure 8 shows the percent change in use of a specific transportation type relative to the second week of January (starting on January 13, 2020). Since the data only begin on January 13, we cannot show what mobility patterns look like in the previous “normal” year. We index this arrest trend to the first week of 2020 (starting on January 1) to anchor both measures to changes relative to a pre-COVID date in 2020. It is worth noting that Massenkoff and Chalfin (2022)—using more detailed location data—show that in 2019, mobility increased due to seasonal trends in the latter half of the year. This is a useful reference point when evaluating the mobility trends shown here.
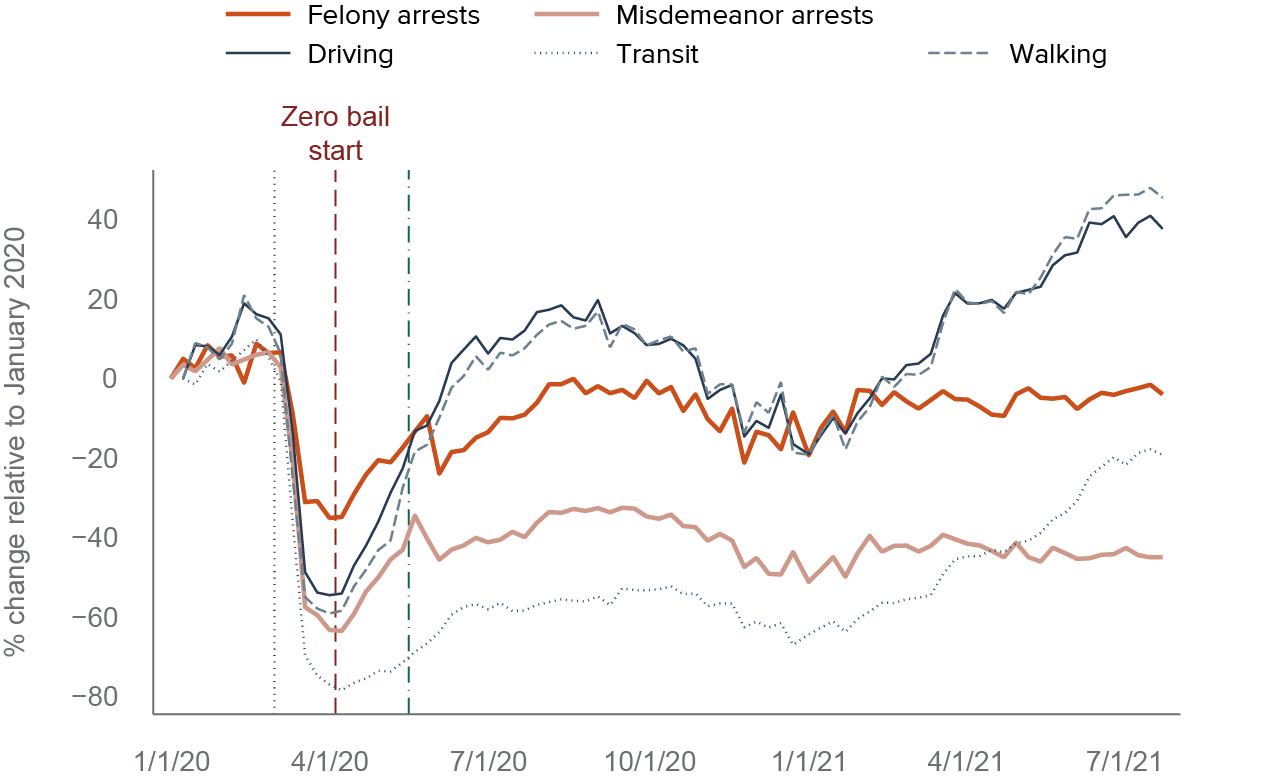
Not surprisingly, movement plunged after Governor Newsom’s state of emergency declaration, prior to the shelter-in-place orders (Figure 8). Driving and walking requests to Apple Maps fell by more than half and transit requests fell by more than 75 percent, reaching their lowest point at the start of April. At that point, movement across all transportation types increased, possibly because of warmer weather. There was a slight jump in driving and walking requests after the murder of George Floyd in late May, which may also have had to do with Memorial Day. Mobility remained roughly stable from early August until late October, with driving and walking requests about 15 percent higher than they had been in January 2020, while requests for public transit information were about 55 percent lower. From late October to January 2021, mobility fell across all transportation types, with reductions of around 15 percent for driving and walking and a drop of over 60 percent for transit. This slump in public movement was probably driven by concerns over COVID and eventually, the shelter-in-place orders issued in Los Angeles County and the five Bay Area counties in late November/early December, which followed statewide closings of non-essential businesses and the imposition of curfews earlier in November. These orders were a response to the most prominent spike in COVID hospitalizations and deaths during the January 2020–July 2021 timeframe.
After the winter of 2020, mobility-related requests increased steadily for the rest of our timeframe. At the end of July 2021, people were walking 50 percent more and driving 40 percent more—while using public transit 20 percent less—than in January 2020. The combination of pent-up demand for traveling and socializing, combined with waning COVID concerns as vaccines rolled out in the spring of 2021 (Bonner 2021), may have driven these increases in movement. Moreover, Californians may have shifted from public transit to driving and walking.
Arrest trends mirror changes in statewide mobility in 2020
SOURCES: Apple Maps location data; California Department of Justice: Automated Criminal History System (ACHS) data.
NOTES: The figure shows weekly percent changes in counts of felony and misdemeanor arrests, and mobility by transportation type from January 2020–July 2021. Both percent changes are relative to the first week of reported data for each dataset (first and second week in January 2020, respectively).
Statewide mobility patterns for driving and walking generally aligned with trends in felony arrests (Figure 8), except after George Floyd’s murder, when arrests spiked. Misdemeanor arrests tracked more closely with transit patterns; with both facing persistent and steeper reductions, but even transit mobility had partially rebounded by July 2021. These trends are particularly closely aligned during 2020, when the major fluctuations in arrests occurred. In percentage terms, mobility declined more than arrests. Mobility then generally recovered to levels higher than the beginning of the year, while arrests did not rebound to the same extent.
The alignment of these trends could reflect a number of possible links between mobility and arrest rates. The first possibility is simply that increases and decreases in mobility represent increases and decreases in Californians’ publicly visible activities. For instance, being out in public less could reduce the likelihood of interacting with law enforcement. Fewer police-public interactions would create fewer opportunities for officers to observe potentially criminal behavior, in turn reducing the chances of an arrest.
Another possibility is that reduced mobility led to fewer opportunities for the commission of crimes. One way this could occur is through shelter-in-place orders that prevented people from being in spaces where certain types of crimes, such as larceny, might be more often committed (Abrams 2021; Scott and Gross 2021). Similarly, public-facing activities such as transportation on foot or via public transit come with some victimization risk. Massenkoff and Chalfin (2022) show a significant correlation between violent crime and mobility trends in 2020. Changes in arrests could, in other words, partially result from underlying changes in crime rates.
Differences across counties point toward a link between mobility and arrests
Comparing the arrest trends of counties with varying mobility patterns can also shed light on the possible impact of public movement on arrests. We compared trends in Kern County, where mobility rebounded far more quickly than it did statewide, to trends in San Francisco, where mobility declined dramatically and did not recover nearly as much.
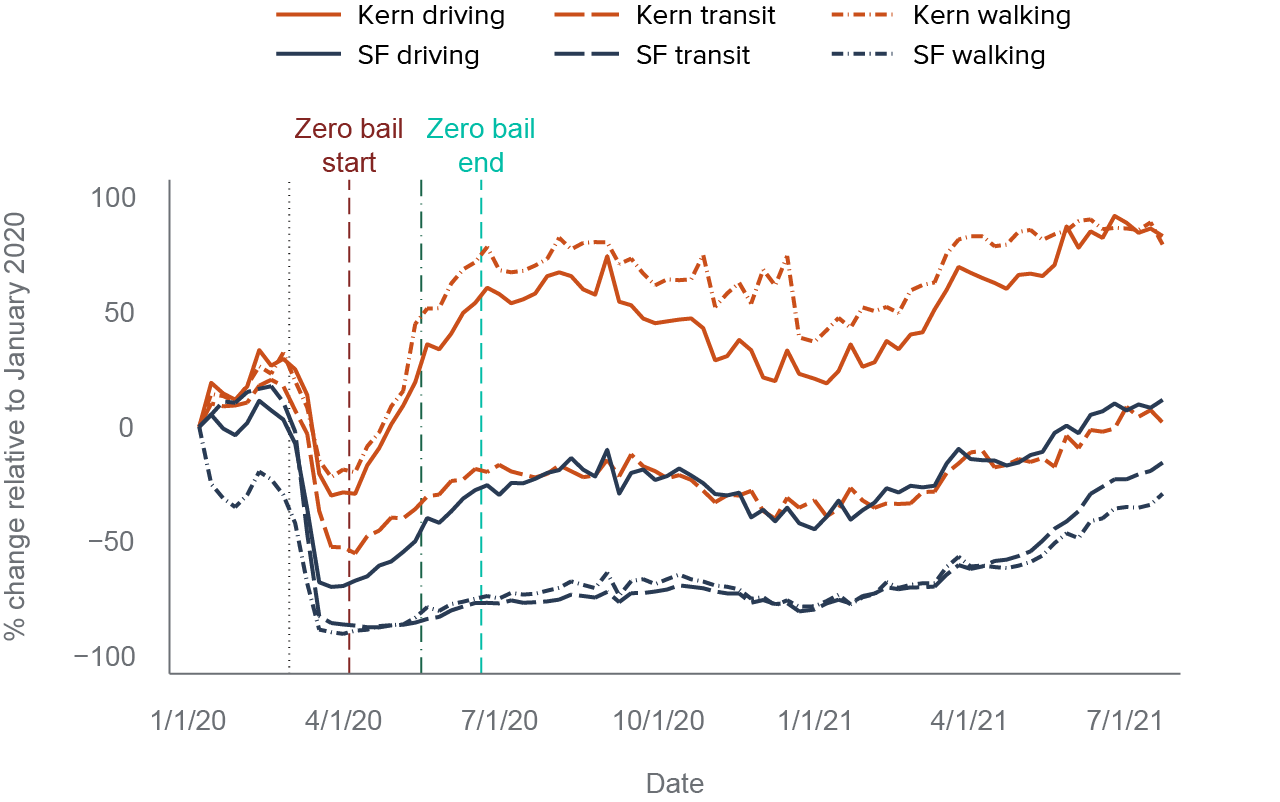
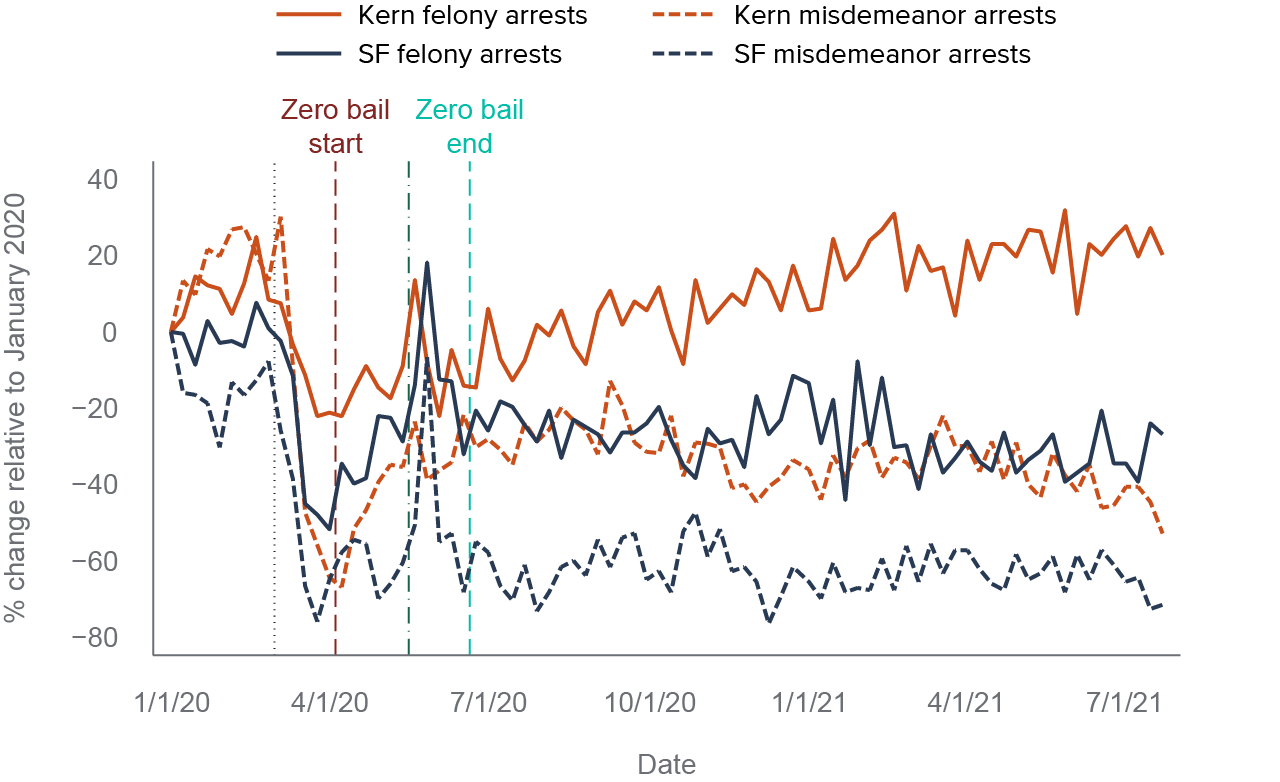
By July 2021, almost 90 percent more Kern residents were driving and walking than they were on January 13, 2020, while 5 percent more were using public transit. Assuming that Massenkoff and Chalfin’s (2022) finding that mobility increased by about 25 percent during the pre-pandemic year of 2019 generally applies to Kern County as well, this increase appears far above the normal rate of increase for mobility. While there were visible slumps in mobility from March–April and October 2020–January 2021, Kern residents walked and drove significantly more than they did in January 2020 by the beginning of 2021 (Figure 9). Kern County’s higher-than-average increases in mobility were associated with higher-than-average increases in felony arrests (Figure 10).
Kern County saw significantly larger increases in mobility relative to San Francisco County
SOURCE: Apple Maps location data.
NOTES: The figure presents mobility trends by transportation type (January 2020–July 2021) in weekly percent changes relative to the second week of January (beginning on January 13, 2020). The dotted gray line marks the date just before Governor Newsom declared a state of emergency (on March 4). On March 16, Bay Area counties instituted a shelter-in-place order. The red dashed line is just before the Judicial Council instituted a statewide zero-bail policy (April 13). The green dashed line is just before the murder of George Floyd (May 25). The blue dashed line is just before the end of the statewide zero-bail order (June 20), which Kern and San Francisco County did not extend.
Conversely, mobility in San Francisco declined precipitously and did not recover quickly (Figure 9). Moreover, unlike in other jurisdictions, the decline in walking in San Francisco was about as dramatic as the drop in public transit. At one point in early April, both walking and transit had fallen nearly 90 percent. The decline perhaps reflected a reduction in tourism and workers traveling to San Francisco; before the pandemic, these inflows were substantial, especially when considering the size of the city. The annual number of visitors dropped from 26 million in 2019 to 10 million in 2020, a dramatic decline that probably played a major role in walking declines (Truong and Jones Thompson 2022). Given the prominence of the technology sector, San Francisco also likely had a larger proportion of people able to work remotely, lessening the need to commute to work when COVID concerns grew (Baldassare 2021). Moreover, according to the US Census, San Francisco County lost the highest percentage of residents during the pandemic relative to other California counties (Smith and Parvani 2022), perhaps partially because it was more difficult to stay physically distant from others in a dense urban county. The effective drop in San Francisco’s population—from reduced tourism and mobility as well as outmigration—likely contributed to the persistent decline in misdemeanor and felony arrests, which is well below statewide and Kern County averages (Figure 10). It will be important for future research to quantify the extent to which the difference in mobility explains the discrepancy in arrest trends versus variation in other factors (e.g., policing or other relevant policies).
Arrests plunged more sharply in San Francisco County than Kern and did not rebound as much
SOURCE: California Department of Justice: Automated Criminal History System (ACHS) data.
NOTES: The figure shows weekly percent changes in counts of felony and misdemeanor arrests from January 2020–July 2021. The percent changes are relative to the first week in January 2020. The dotted gray line is just before Governor Newsom declared a state of emergency (March 4). On March 16, Bay Area counties instituted shelter-in-place order. The red dashed line is just before Judicial Council instituted a statewide zero-bail policy (April 13). The green dashed line is just before the murder of George Floyd (May 25). The blue dashed line is just before the end of statewide zero-bail order (June 20), which Kern and San Francisco County did not extend.
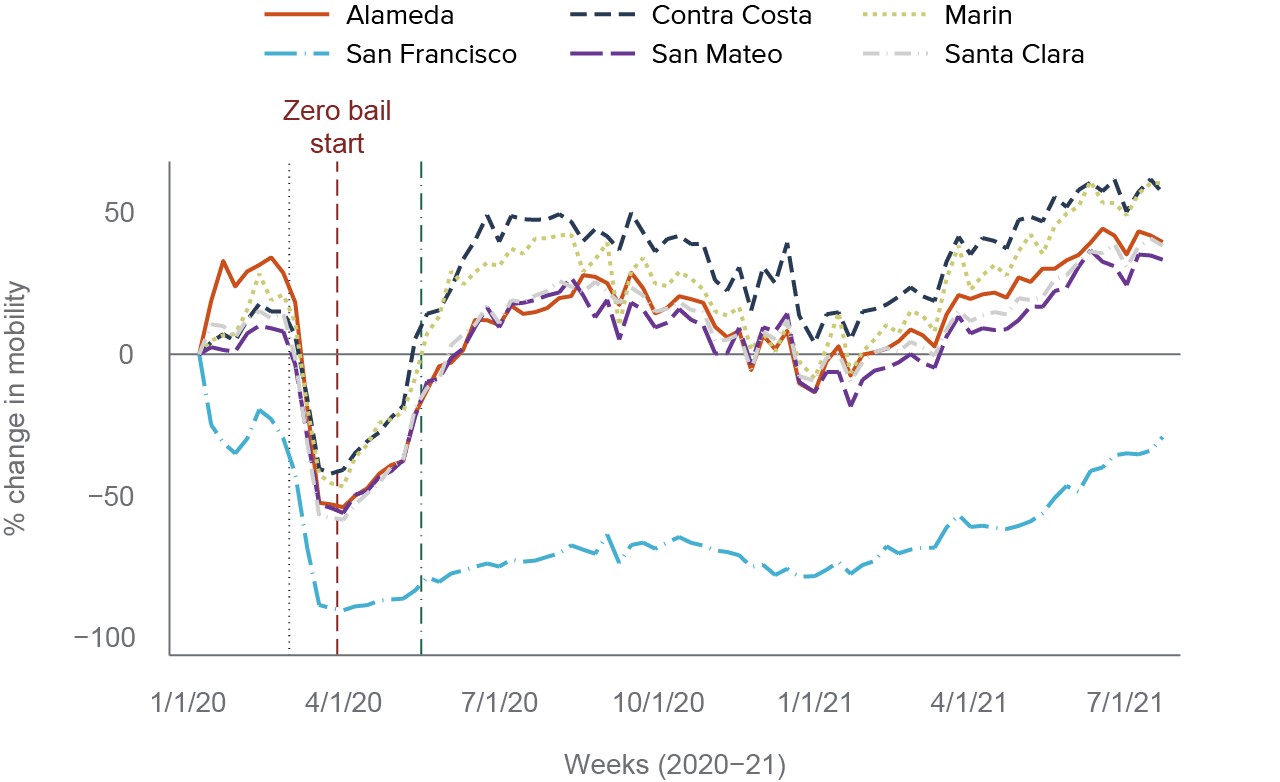
Another plausible explanation for the difference in mobility between San Francisco and Kern is that San Francisco—along with neighboring Bay Area counties—imposed stricter and longer shelter-in-place orders. In terms of transit or driving (Technical Appendix Figures A10 and A11), San Francisco had the least mobile population but followed the general trend as other Bay Area counties. However, walking activity in San Francisco was noticeably different from walking in other Bay Area counties (Figure 11).
San Francisco’s heavily reduced walking activity was unique, even among Bay Area counties
SOURCE: Apple Maps location data.
NOTES: The figure presents walking mobility trends from January 2020 to July 2021 by county in weekly percent changes relative to the second week of January (beginning on January 13, 2020). Figure shows the start of the statewide zero-bail order, although it may be notable that San Francisco’s district attorney instituted a non-monetary pretrial release policy on February 10, before the statewide order. The dotted gray line marks the date just before Governor Newsom declared a state of emergency (March 4). On March 16, Bay Area counties instituted a shelter-in-place order. The red dashed line is just before Judicial Council instituted the statewide zero-bail policy (April 13). The green dashed line is just before the murder of George Floyd (May 25). Zero bail continued in all Bay Area counties, except San Francisco, which ended the policy on June 20, 2020.
The differences highlighted here are consistent with a linkage between mobility and arrests. They may explain why San Francisco saw the most marked declines in property and violent crime among California’s 15 largest counties during 2020 (Lofstrom and Martin 2022). Indeed, researchers have found patterns consistent with the mobility-arrests connection and find that San Francisco experienced by far the most dramatic decrease in mobility of any major US city (Lopez and Rosenfeld 2021). This connection is documented across the literature in cities around the globe: Massenkoff and Chalfin (2022) highlight the connection between victimization and being in a public space, while Abrams (2021) and Nivette et al. (2021) explore the link between changes in mobility and crime. Other research has found that law enforcement agencies made fewer arrests because of reduced interactions with the public (e.g., officers are less likely to stop an individual, and find contraband or an outstanding warrant for arrest) (Abrams, Fang, and Goonetilleke 2022). Thus, there are myriad connections between arrests and public movement.
The data suggest that mobility may have played a significant role in the arrest reductions observed in California early in the pandemic, but the relationship is not completely consistent across time and offense type. For instance, the association between felony and misdemeanor arrests and mobility levels was stronger in 2020, when arrest levels changed more substantially. Additionally, as mobility began to recover in both San Francisco and Kern Counties, felony arrests rebounded more than misdemeanor arrests—with larger increases in Kern. We see the same contrast among Bay Area counties: depressed mobility in San Francisco relative to the rest of the Bay Area corresponded with noticeably fewer felony arrests (Technical Appendix Figure A9). The role of mobility is less clear in misdemeanor arrests, which are comparably low in a few Bay Area counties (Technical Appendix Figure A8).
More research is required to understand these apparent differences in the connection between mobility and arrests over time, region, and/or across types of arrest. Officers typically have more discretion in misdemeanor arrests, and reductions in enforcement for non-serious offenses were mandated at the onset of the pandemic, so it is possible that increased public mobility created additional opportunities for criminal acts and additional police-public interactions that led to arrests. These factors may help account for the relatively quicker rebound of felony arrests over misdemeanor, as these were the offenses serious enough to prioritize enforcement.
Other research on the link between mobility and arrests during the pandemic has arrived at similar conclusions. Using fixed-effects panel regression, Lopez and Rosenfeld (2021) observed “decreases in the rates of serious assault, robbery, and larceny, as people spent more time in their homes during the early months of the pandemic.” However, their study finds that changes in mobility levels affected offenses such as homicide, gun assault, burglary, drug offenses, and domestic violence only at certain points during the pandemic, and that mobility changes did not seem to have any effect on motor vehicle theft. This reinforces the need for more research on how mobility affects arrests, while confirming our general impression that mobility appears to influence arrest rates to a large extent.
This apparent relationship between public movement and arrests at the county level may be generalizable to the entire state. From January to April 2020, as mobility plunged in every county for which data is available, so did felony and misdemeanor arrests. While there was variation in the degree to which arrests and mobility decreased, this general pattern appears to be present across counties (Technical Appendix Figure A12). After reaching historic lows in early April 2020, arrests partially rebounded through June 2020. This trend appears to be similar across some Californian counties, regardless of whether the counties decided to maintain zero bail after the state rescinded the policy in June (Technical Appendix Figures A8 and A9). Again, however, this mobility-arrest connection may not have held as strongly in 2021, as trends in arrests and mobility diverged more significantly (Technical Appendix Figure A13).
Law enforcement interactions with the public also changed
Decreased movement in public places, along with law enforcement policies that reduced interactions with the community, contributed to the substantial decreases in police stops of the public. Using data from the California Department of Justice’s Racial and Identity Profiling Act, we distinguish how interactions and enforcement patterns changed during this period. We focus on the 14 largest local law enforcement agencies in California.
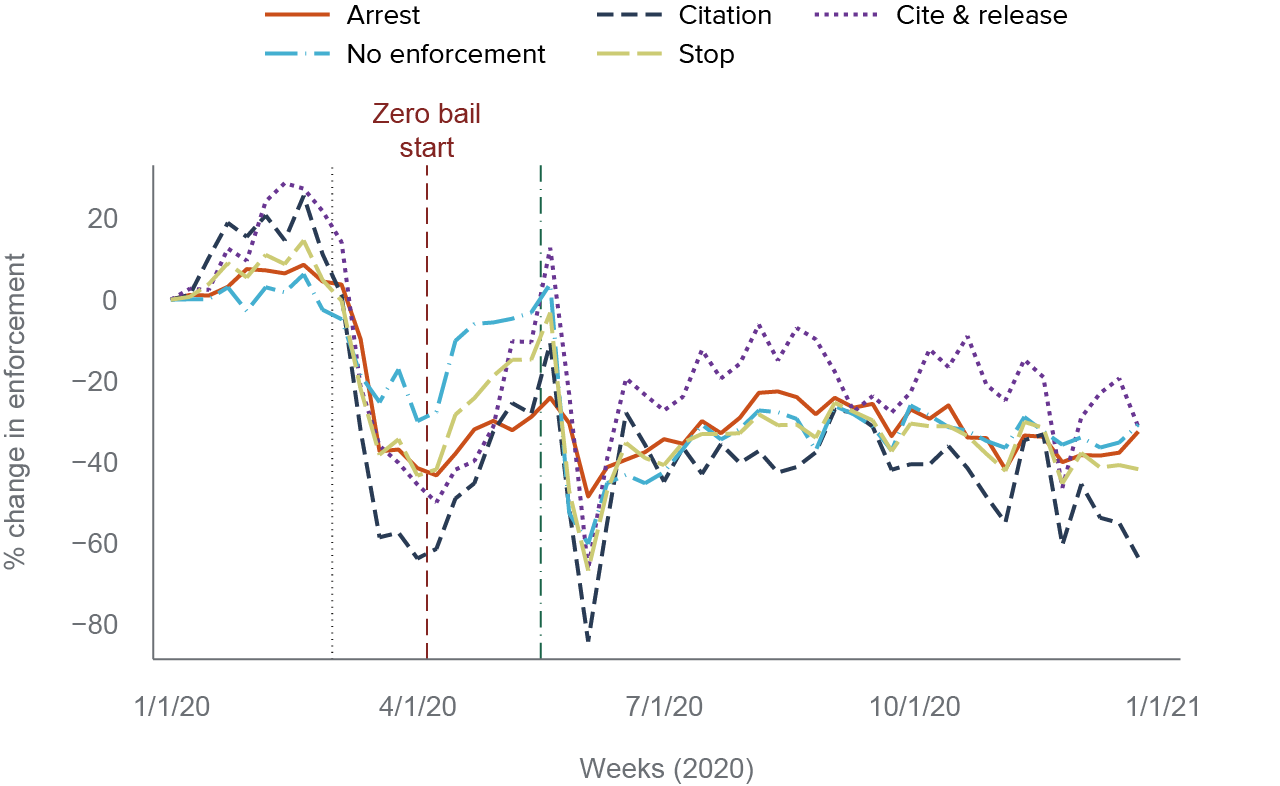
From January 2019 to late February 2020, there were about 34,900 weekly stops on average. From March 2020 to December 2020, that number dropped to 21,700 (Technical Appendix Figure A14); law enforcement conducted significantly fewer vehicle and pedestrian stops, resulting in a decline of 43 percent in early April, similar to arrests (Figure 12). From early April to the end of May, stops partially rebound relative to pre-COVID levels, along with mobility patterns. After the murder of George Floyd, there is a brief spike in stops of 14 percent relative to the week before, akin to observed increases in arrests. However, unlike arrests and mobility, stops declined dramatically in the subsequent two weeks, culminating in a decline of more than 60 percent in vehicle and pedestrian stops—there were only about 10,600 stops two weeks after the murder of George Floyd. This is consistent with reductions in police activity following other high-profile police killings (Premkumar 2019; Cheng and Long 2022), and it was probably a factor in the (more minor) drop observed in felony and misdemeanor arrests. Stops rebounded but only partially, to about 35 percent fewer interactions relative to the first week of January 2020, or 20,800 weekly stops. Overall, this provides evidence that police-public interactions were reduced persistently during this timeframe, which affected arrest levels.
When we look at enforcement patterns associated with these stops, we see the smallest declines in stops that resulted in no formal enforcement (i.e., the stopped individual was let go with no action, a warning, or the officer filled out a field interview card), followed by stops that ended with a field cite and release (i.e., a non-custodial arrest for a lower-level incident that could have led to a booking but instead leads to a summons that includes a court date). After the state zero-bail order was implemented, stops resulting in no formal enforcement or a cite and release rebounded relatively quickly, returning to levels seen during the first week of January 2020. After the murder of George Floyd, however, it appears that stops that ended without formal enforcement became proportionally smaller and began to fluctuate similarly to changes in police-public interactions, while cite-and-releases became proportionally greater. These trends are potentially indicative of law enforcement officers working to limit sanctions and to mitigate COVID transmission among the jail population, as intended by court orders and law enforcement cite-and-release policies. Stops that resulted in citations for minor infractions declined most sharply, suggesting that officers curtailed those practices. Finally, stops that resulted in custodial arrests (i.e., the individual was taken to a booking facility) tracked closely with the percent change in stops and cite-and-releases before the Judicial Council zero-bail order. Afterward, similar but more muted fluctuations in stops ending in arrest reflect the patterns in the ACHS data.
How Did COVID Affect Re-arrest Trends?
At the outset of the pandemic, concerns were raised that policies aimed at reducing arrests or detentions would lead to an increase in crime. Debates about criminal justice policies creating a “revolving door” through which people cycle in and out of the system preexisted the pandemic, but concern mounted as some types of crime increased in the first year of the pandemic (Rynor 2021; Lofstrom and Martin 2022; Rynor 2022). One way to investigate these concerns is to examine whether changes in re-arrests are correlated with the implementation of pandemic-era criminal justice policies.
As noted above, our analysis focuses on the number of re-arrests in a 90-day time span, the percent change in the number of re-arrests, and the share of re-arrests out of all arrests for a certain offense type. We also examine whether there are differences between misdemeanor and felony re-arrests.
As we have seen (Figure 3), the weekly number of re-arrests over a 90-day period dipped significantly in the initial months of COVID. This steep decline was driven by misdemeanor re-arrests. Misdemeanor and overall re-arrest tallies remained persistently low—40 to 60 percent and 20 to 40 percent, respectively—relative to the first week of January 2020 (Technical Appendix Figure A15). These patterns are similar to misdemeanor arrest trends during this period.
In contrast, felony re-arrests were higher from late June 2020 until at least July 2021 than they had been at the beginning of January 2020. Changes in felony and violent felony re-arrests, however, are smaller and more variable than changes in misdemeanor and general re-arrests—partly because of the smaller number of incidents. After June 2020, felony re-arrests increased 5 to 15 percent relative to the first week of January 2020, while violent felony re-arrests either held steady or declined as much as 10 percent. This general pattern holds whether re-arrests are measured within 30 days, 730 days, or without any time restrictions.
Re-arrests do not appear to have changed significantly immediately after the murder of George Floyd, with the potential exception of violent felony re-arrests, which increased temporarily. However, this temporary spike in violent felony re-arrests could be an artifact of measuring percent changes with low weekly counts; there are several similar-sized spikes through the trend line for violent felony re-arrests.
It is likely that these raw re-arrest numbers were affected by significant underlying changes in arrests during this period. For instance, decreases in overall arrests may have led to decreases in the number of re-arrests but the share of arrests that were re-arrests might have gotten larger. To account for fluctuations in total arrests, we measure the weekly share of arrests of individuals who had already been arrested within the past 90 days. We found that the share of re-arrests remains relatively stable for the first months of the pandemic and then consistently declines in June 2021 (Figure 13). For most of 2020–21, about 40 percent of arrests each week involved an individual who had been arrested in the previous 90 days, but that share drops to 32 percent by July 2021. For the misdemeanor re-arrest share, there is a steady decline throughout the sample frame, starting from 34 percent and ending at 23 percent. That decrease is partially offset by increases in the felony re-arrest share from 29 percent to 32 percent after April 2020. Notably, at that point, the share of felony re-arrests is larger than the share of re-arrests for misdemeanors and there were also notable reductions beginning in June 2021. The share of violent felony re-arrests within 90 days is much lower, starting at around 13 percent, and that share similarly declines along with overall arrests, eventually falling to 9 percent.
Overall, we find evidence that the number and share of re-arrests remained roughly flat or decreased during the pandemic—with the important exception of felony re-arrests. Broadly, we do not observe changes exclusive to re-arrest patterns that coincide with key events during this pandemic period. Since the spike in felony arrests after the murder of George Floyd did not involve a corresponding increase in felony re-arrests within 90 days, the implication is that this spike occurred due mostly to the arrests of people who had not been regularly or previously involved with the criminal justice system. When we look at individuals with any re-arrest within the entire timeframe, we see a slight increase in felony re-arrests after the murder, but not comparable to the increase in felony arrests. Future research should explore why re-arrests declined during the June to July 2021 period and whether that trend has continued beyond the timeframe for this report.
Conclusion
Arrests began to plunge in California in early March 2020. This phenomenon was driven by a 50 percent reduction in misdemeanor arrests that persisted until at least July 2021. Felony arrests underwent a similar but more muted change at the onset of the pandemic and then moved upward without reaching pre-pandemic levels. Though some COVID-era criminal justice policies and measures expired after a few months, arrests remained at these lower levels until at least July 2021. Declines in stops, shifts in enforcement practices during stops, and fewer arrests helped drive reductions in new admissions into jail, which remained about 30 percent lower than before the pandemic until at least December 2021; there has also been a sustained decline in prison admissions and in the overall incarcerated population.
Reductions in arrests occurred across all races, but not evenly across counties or crime types—they were concentrated in lower-level offenses related to drugs and driving. The timing of the reductions aligned with Governor Newsom’s declaration of a COVID-19 state of emergency, which preceded both the shelter-in-place and zero-bail order, making it unclear how these latter policies affected arrests.
Mobility patterns appeared to be a primary driver of arrest trends during 2020. Reduced mobility was linked to decreases in arrests, while upticks were consistent with rebounds. We find that differences in arrest patterns across counties may be linked with similar deviations in mobility patterns. These findings align with recently published academic research during the COVID-19 period on the relevance of mobility and being in a public space on arrests and crime (Abrams 2021; Nivette et al. 2021; Massenkoff and Chalfin 2022). This relationship was not as close in 2021, when arrests did not fluctuate as substantially. Research that directly quantifies how much variation in arrests can be attributed to mobility versus other criminal justice directives is needed.
After reaching historic lows in the beginning of April 2020, arrests partially rebounded through June 2020. This trend was similar across Californian counties, regardless of whether the counties decided to maintain zero bail after the state rescinded the policy in June. It remains unclear what effect zero-bail policies had on arrest and re-arrest rates; further investigation is needed.
Shifts in policing strategies may have influenced arrest trends. Law enforcement stops by 14 of the largest local agencies declined by around 35 percent until at least the end of 2020. How those stops were enforced also changed: Early in the pandemic, officers were more likely to let stopped people go, with and without warnings. Later, cite-and-release arrests became proportionally more common. There was a dramatic decline in stops in the two weeks after the murder of George Floyd; vehicle and pedestrian stops declined more than 60 percent during this period. Reductions in stops and enforcement, which are associated with public mobility patterns, contributed to declines in arrests.
The civil unrest in the wake of the murder of George Floyd was closely associated with a brief, racially disparate increase in arrests. There were minor increases in misdemeanor arrests across racial/ethnic groups, along with a spike in felony arrests of Black individuals. This temporary jump was driven largely by arrests for property crimes, but also by smaller increases in arrests for conduct and drug crimes. For the most part, the individuals arrested during this period had not been arrested recently (i.e., they were not re-arrests).
Overall, we find evidence that re-arrests generally mirrored arrest trends during the pandemic and did not change significantly in the wake of key events. An important caveat to this finding is that the felony re-arrest share did increase beginning in late March 2020 and was consistently higher than the misdemeanor re-arrest share from late June 2020 until at least July 2021—during this period, felony re-arrests were greater in number than in early January 2020. Re-arrests were positively correlated with arrest fluctuations (and mobility): they fell significantly in February and March as arrests dropped, and then rose in April. The partial rebound in April re-arrests was larger for felonies. However, from 2018–2021, the proportion of arrests that were re-arrests generally declined. The determinants of the steep declines in the proportion of arrests that were re-arrests beginning in June 2021 are unclear, and we do not yet know whether that trend continued into 2022.
While arrest patterns broadly resemble mobility patterns, it is possible that zero bail, cite-and-release orders, and early releases from jails and prisons simultaneously influenced arrests and re-arrests. Further research that isolates the impact of these policies is needed. An important finding for policymakers looking to understand this unprecedented period is the substantial association between public movement and arrests, which seemingly eclipsed other factors.


