California’s violent crime rate increased in 2021.
- California’s violent crime rate increased by 6.0%, from 440 per 100,000 residents in 2020 to 466 in 2021. While robberies fell somewhat (by 1.9%), aggravated assaults jumped by 8.9%, and homicides and rape increased by 7.7% and 7.9%, respectively.
- In 2021, aggravated assaults were 67% of reported violent crimes; 24% were robberies, 8% were rape, and 1% were homicides.
- California’s violent crime rate in 2020 (the latest nationwide statistics available) was higher than the national rate of 387 per 100,000 residents and ranked 16th nationwide.
Overall, violent crime is much lower than its 1992 peak, with rates staying fairly stable over the last decade.
- After reaching a peak of 1,115 per 100,000 residents in 1992, California’s violent crime rate steadily fell, reaching a 50-year low of 392 in 2014.
- While the violent crime rate has fluctuated year-over-year, it has remained relatively stable this past decade—between 428 and 466, hovering near its 2010 level (440), when California embarked on major criminal justice reforms.
While violent and property crime rates increased in 2021, both remain relatively low
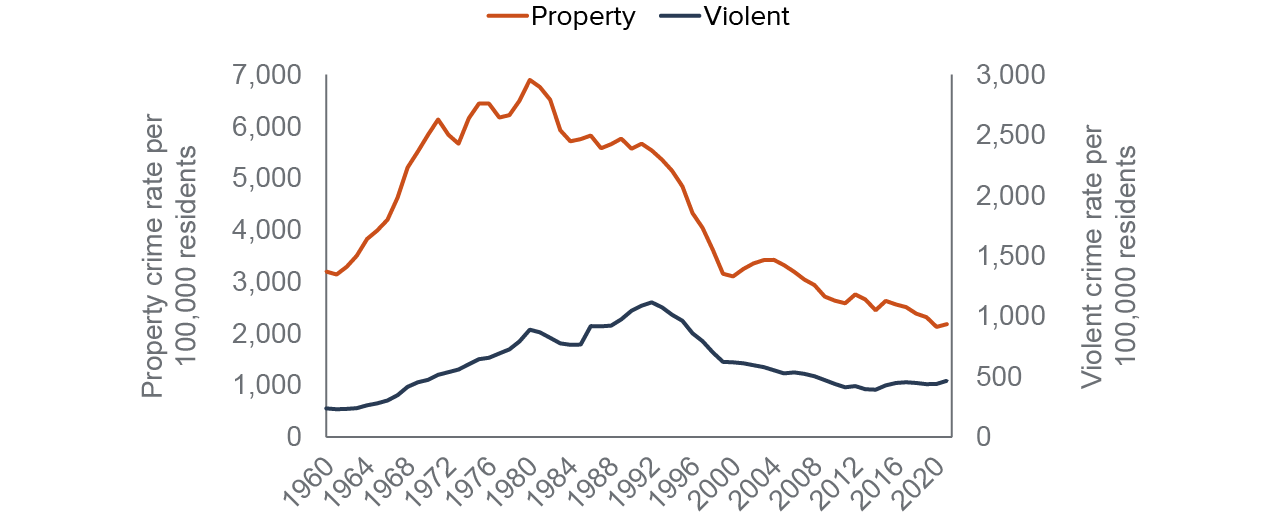
SOURCES: Authors’ calculation based on Federal Bureau of Investigation’s Uniform Crime Report 1960–2002 and the California Department of Justice’s Criminal Justice Statistics Center, California Crimes and Clearances Files, 2003–2021.
NOTE: Violent crime includes homicide, rape, robbery, and aggravated assault; property crime includes burglary, motor vehicle theft, and larceny theft (including non-felonious larceny theft).
Driven by gun-related incidents, however, homicides and aggravated assaults are rising.
- Compared to 2019 pre-pandemic levels, robberies were down by 15.8% and rape by 1.5% in 2021—but homicides jumped by 41.2% and aggravated assaults by 18.0%. Gun-related homicides and aggravated assaults surged by 52% and 64%.
- And while robberies fell, robberies involving a firearm rose by 0.4% in 2021 compared to 2019.
The statewide property crime rate also ticked up in 2021.
- The 2021 property crime rate of 2,178 per 100,000 residents remained low, but has ticked up 2.4% from 2020, when it reached the lowest level observed since 1960.
- After a 15.3% drop in 2020, larceny rose by 3.0% in 2021. Auto theft continued its 2020 climb, up an additional 7.6%—now up by 28.4% compared to 2019. Burglaries dropped by 5.8%—now down by 9.7% compared to 2019.
- Of all reported property crimes in California in 2021, 63% were larceny thefts, 16% were burglaries, and 21% were auto thefts. Larceny is unlawful taking of someone else’s personal property, robbery is theft by violence or threat, and burglary is entering a structure with intent to commit a crime.
Crime rates vary dramatically by region and category.
- The lowest violent crime rate—at 305 per 100,000 residents in 2021—was on the southern coast and border (Imperial, Orange, San Diego, and Ventura Counties), while the Sierra region had the lowest property crime rate, at 1,603 per 100,000 residents.
- The state’s highest rate of violent crime was in the San Joaquin Valley, which had 640 violent incidents per 100,000 residents. The highest rate of property crime was in the San Francisco Bay Area, at 2,718 per 100,000 residents.
Violent crime increased in most counties . . .
- Of the state’s 58 counties, 37 saw violent crime rise in 2021, with rates in 10 counties increasing by 20% or more. However, 8 of these 10 counties are smaller counties, which are especially susceptible to wide swings in crime rates due to small populations and rare instances of violent crime.
- Violent crime rose in 11 of the state’s 15 largest counties, and 3 saw increases of at least 10%. Fresno faced the biggest jump, by 24.1%.
. . . and property crime in many counties increased as well.
- Property crime rose in 24 counties in 2021—including 7 of the 15 largest. In 13 counties—including 2 of the 15 largest—the property crime rate jumped by at least 10%. San Francisco saw the largest increase, by 16.9%.
- While property crime fell in 8 of the 15 largest counties, the decreases were relatively modest, with Ventura’s 6.3% drop the largest.
Violent crime rates increased in most of the state’s 15 largest counties in 2021
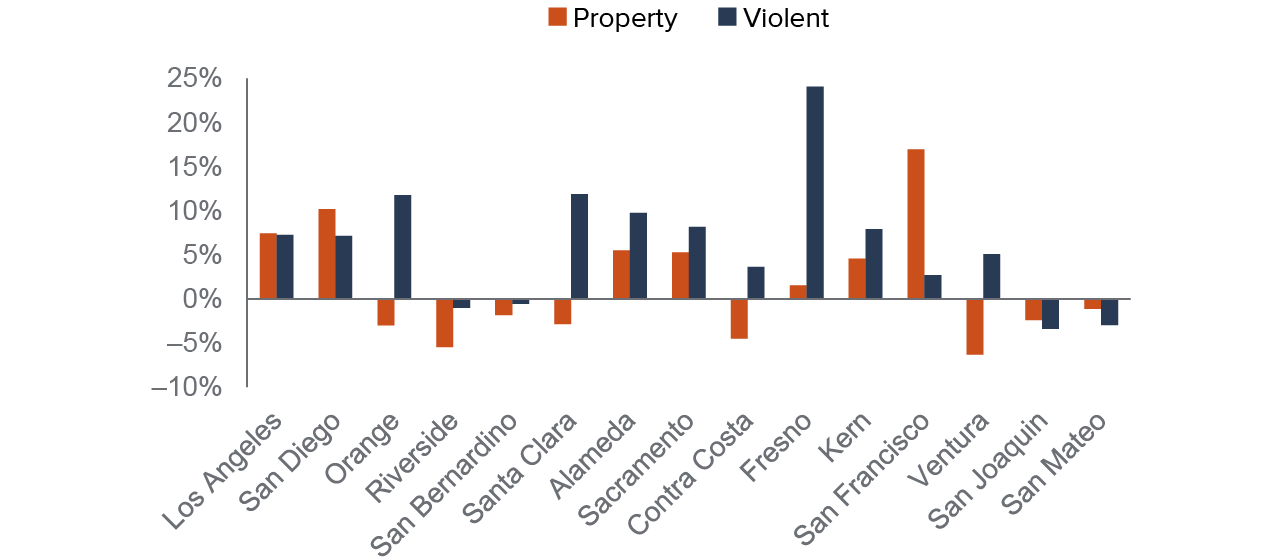
SOURCE: Authors’ calculation based on the California Department of Justice’s Criminal Justice Statistics Center, California Crimes and Clearances Files, 2020–2021.
NOTES: Chart shows California’s 15 largest counties, sorted by population size. Violent crime includes homicide, rape, robbery, and aggravated assault; property crime includes burglary, motor vehicle theft, and larceny theft (including non-felonious larceny theft).
Topics
COVID-19 Criminal JusticeLearn More

Assessing the Impact of COVID-19 on Arrests in California

Concerns about Crime Are Up, Views of Police Are Down

Californians Worry over Mass Shootings, Favor Stricter Gun Laws

Commentary: What Do We Need to Learn about Preventing Mass Shootings?

Mass Shootings in California