


In a recent post, we provided a snapshot of the sheltered homeless population in California during the first year of the pandemic. In this post, we look at some preliminary results from the recent 2022 point-in-time homelessness count—the first since January 2020—which includes both sheltered and unsheltered homelessness. These results, together with our analysis below—of local variations in sheltered homelessness during the first year of the pandemic—suggest that some counties were able to reduce their unsheltered homeless populations by expanding capacity mainly in so-called noncongregate settings, such as hotel and motel rooms.
While the US Department of Housing and Urban Development won’t release consolidated point-in-time counts for the state until next year, we can gain insights from recently released reports by 7 of the 10 counties with the largest homeless populations—Alameda, Orange, San Bernardino, Riverside, San Diego, San Francisco, and Santa Clara. These reports provide a first look at shifts in the homeless population during the pandemic.
Alameda, Riverside, San Diego, San Bernardino, and Santa Clara reported increases in their overall homeless populations, while both Orange and San Francisco Counties reported declines. Six of the seven counties (all except Orange) saw a spike in sheltered homelessness between 2020 and 2022, and there was a clear reduction in the unsheltered homeless population in Orange, San Francisco, Riverside, and Santa Clara Counties between 2020 and 2022.
It is important to note that these results reflect not just the injection of resources that happened in response to the pandemic, but also pre-pandemic investments that are starting to materialize (Prop C in San Francisco, for example). The fact that we did not see a greater increase in homelessness speaks to multiple efforts at state and local levels.
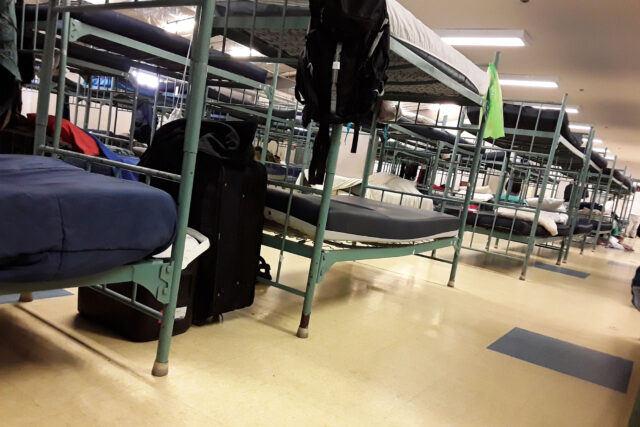
However, shifts in sheltered homelessness can be traced in part to social distancing requirements during the first year of the pandemic, which prompted most congregate shelters— sites with shared living spaces, often times dormitory-style—to limit capacity, while some shelters shut their doors. In response, counties turned to hotel/motel voucher programs and other noncongregate options to increase capacity. Funding to support this switch came primarily from state and federal sources—largely special allocations for local responses to the pandemic.
Between 2020 and 2021, the state saw a 7% increase in sheltered homelessness—30% of overall homelessness, according to the last full point-in-time count in 2020. However, there were important variations at the local level. For example, half of the 10 counties with the largest sheltered homeless populations in 2020 saw increases, while the other half registered declines.
Three Bay Area counties—Alameda, Santa Clara, and San Francisco—reported the largest increases. Interestingly, before the pandemic, Santa Clara and Alameda had lower shares of their homeless populations in shelters (18% and 22%, respectively) than the statewide average, while in San Francisco the share was 36%, above the state average.
At the other end of the spectrum, Stanislaus County—where almost half of the homeless population was sheltered before the pandemic—saw the largest decrease in sheltered homelessness. Los Angeles, the locality with the nation’s second-largest population of people experiencing sheltered homelessness, saw a slight decrease.
In counties where sheltered homeless populations increased between 2020 and 2021, new efforts to expand noncongregate shelter capacity more than compensated for pandemic-related decreases in congregate capacity. For example, San Francisco doubled the number of people living either in newly created non-congregate shelters or in projects that expanded congregate capacity, while the number of people in shelters that reduced their capacity declined by 65%. Overall, there was a net increase of 36% in the sheltered homeless population. In contrast, in Orange County the increase in the number of people experiencing homelessness in newly created or expanded shelters did not compensate for reductions in capacity.
More counties will release 2022 point-in-time reports this summer, deepening our understanding of COVID’s impact on homelessness. As more data becomes available, PPIC will continue to track changes in the state’s homeless population and monitor state and local efforts to address homelessness.
Topics
coronavirus COVID-19 Health & Safety Net homelessness Housing Population Poverty & Inequality safety netLearn More
A Snapshot of Homeless Californians in Shelters

For California’s Homeless, CalFresh Is Essential Part of Safety Net

How Hospital Discharge Data Can Inform State Homelessness Policy
Most Californians Continue to Identify Homelessness as a Big Problem
Video: Homelessness in California’s Cities