Table of Contents
- Key Findings
- Top Issues and Overall Mood
- Gubernatorial Election
- State Propositions 1, 27, and 30
- Congressional Elections
- Local Election Issues: Homelessness and Crime
- Approval Ratings
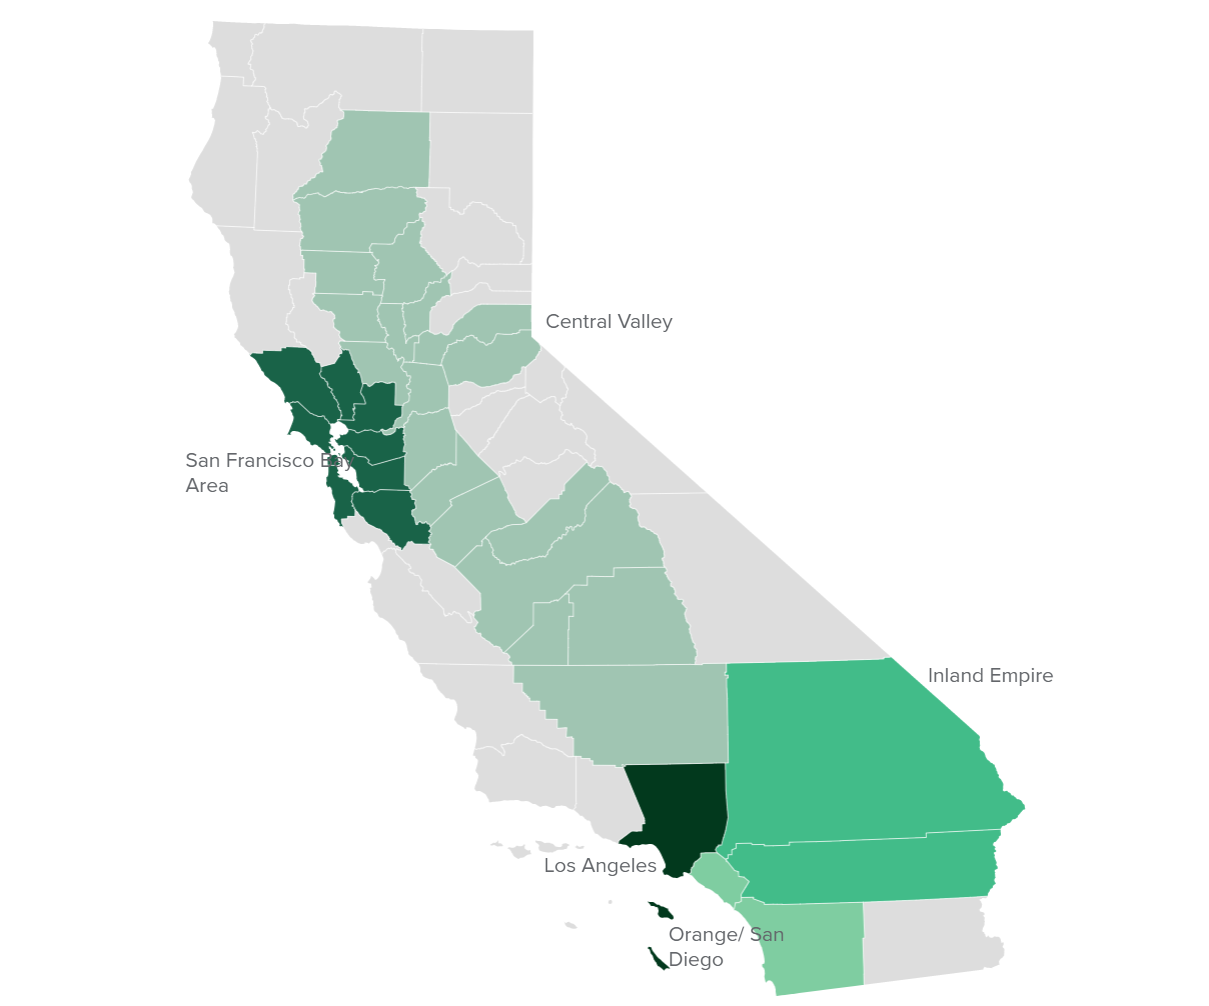
- Regional Map
- Methodology
- Questions and Responses
- Authors and Acknowledgments
- PPIC Statewide Advisory Committee
- PPIC Board of Directors
- Copyright
Key Findings
The midterm campaign season enters its final stretch after Labor Day—in the context of rising consumer prices and higher interest rates that have created financial turbulence and uncertainty about job growth. Meanwhile, Californians are feeling the impact of climate change: severe drought, heat waves, and wildfires. Recently passed federal and state legislation aims to address these issues ahead of the highly consequential November 8 election.
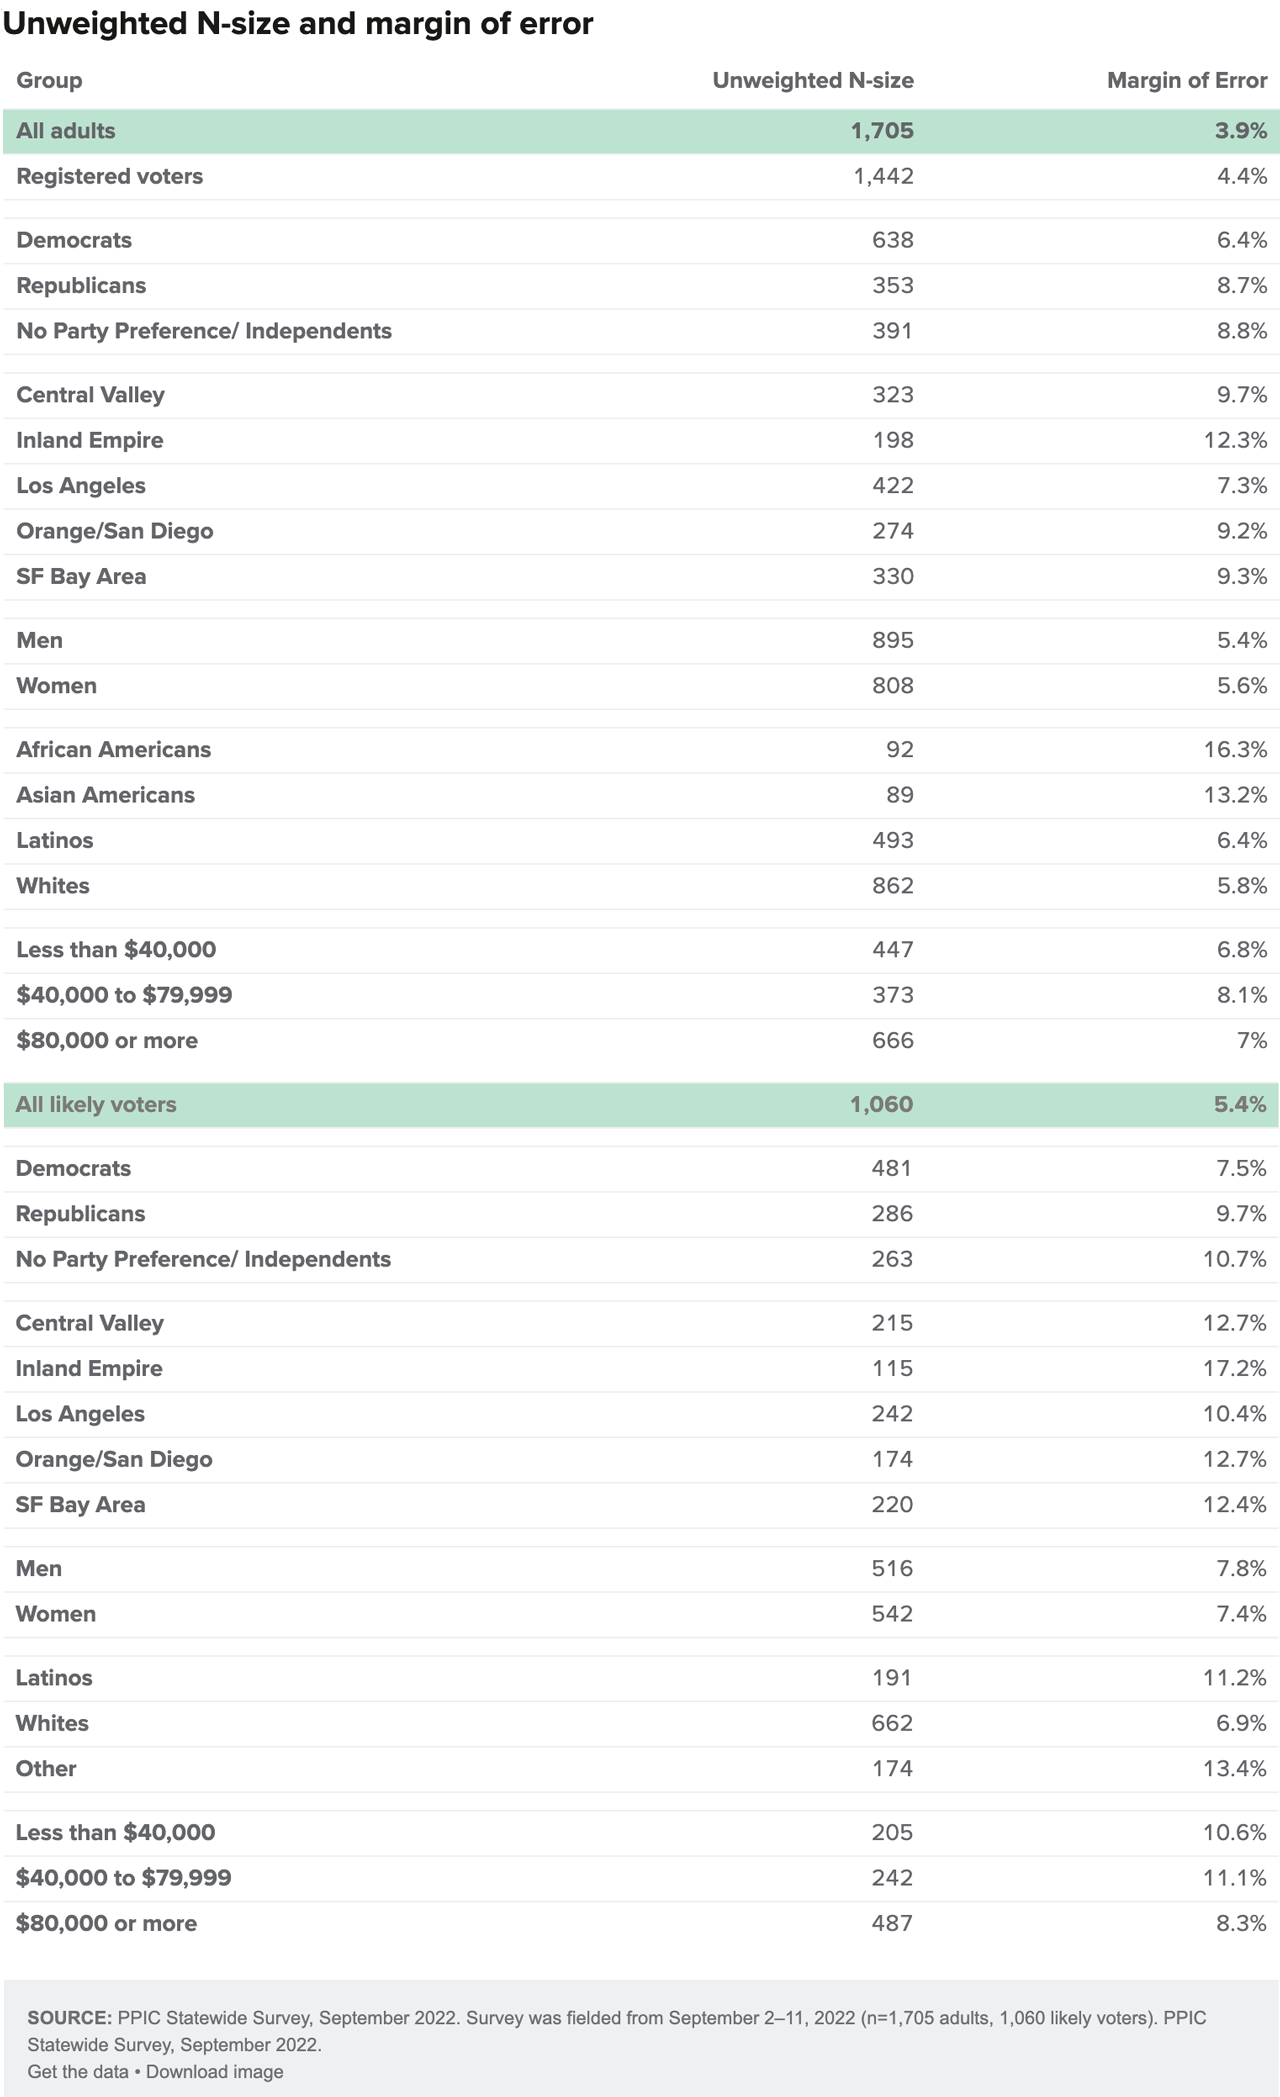
These are among the key findings of a statewide survey on state and national issues that was conducted from September 2 to 11 by the Public Policy Institute of California:
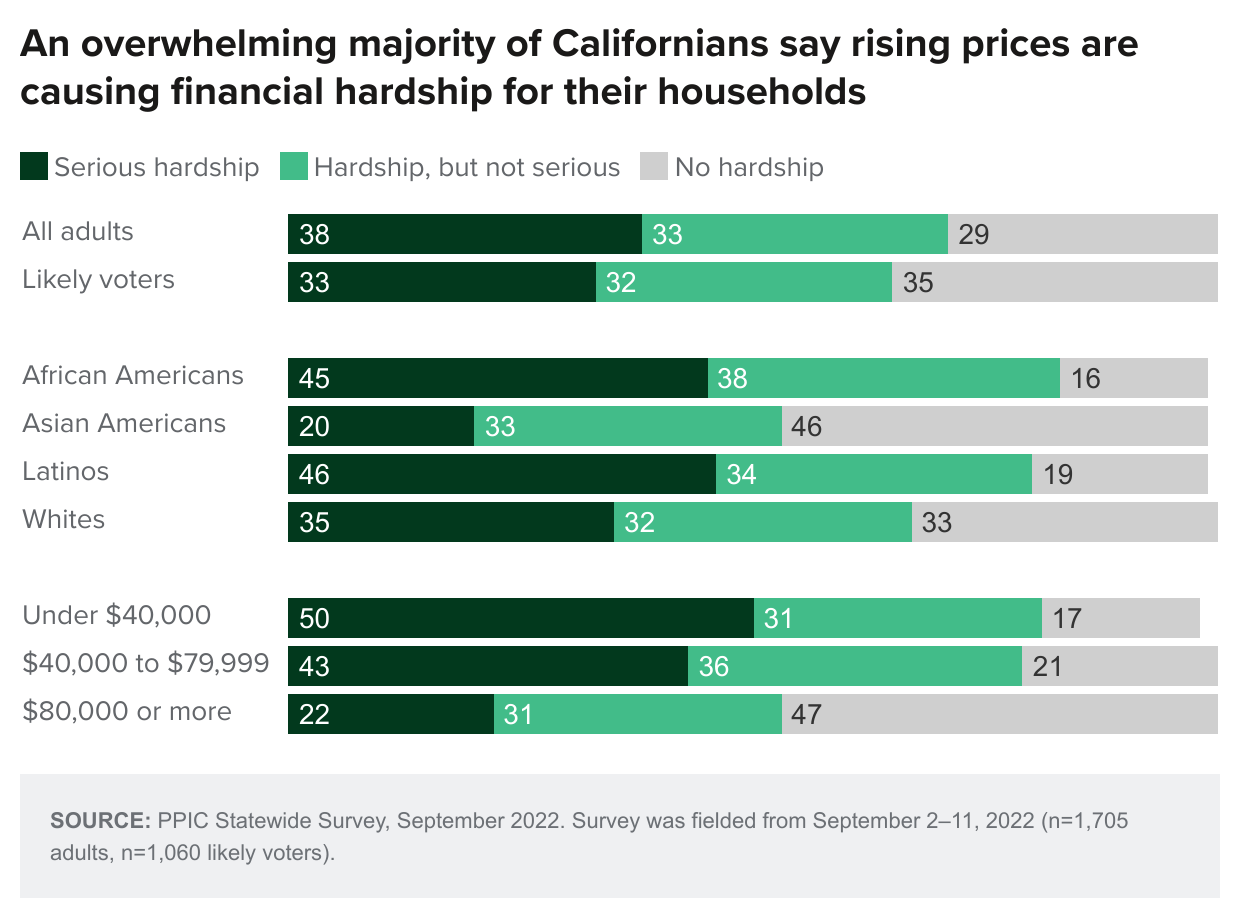
 Californians name the economy and inflation as the top issue facing the state. Thirty-eight percent of Californians—and 50 percent of lower-income adults—report serious hardships from rising prices. Fifty percent say that things in California are going in the right direction. By comparison, 35 percent think things in the US are going in the right direction while 28 percent expect the US to have good times financially during the next 12 months. →
- Among California likely voters, 58 percent would vote for Gavin Newsom and 31 percent would vote for Brian Dahle if the election were held today. Half are very or fairly closely following the news about the governor’s race this year. Fifty-three percent are satisfied with their choices of candidates in the governor’s race, with partisans divided. →
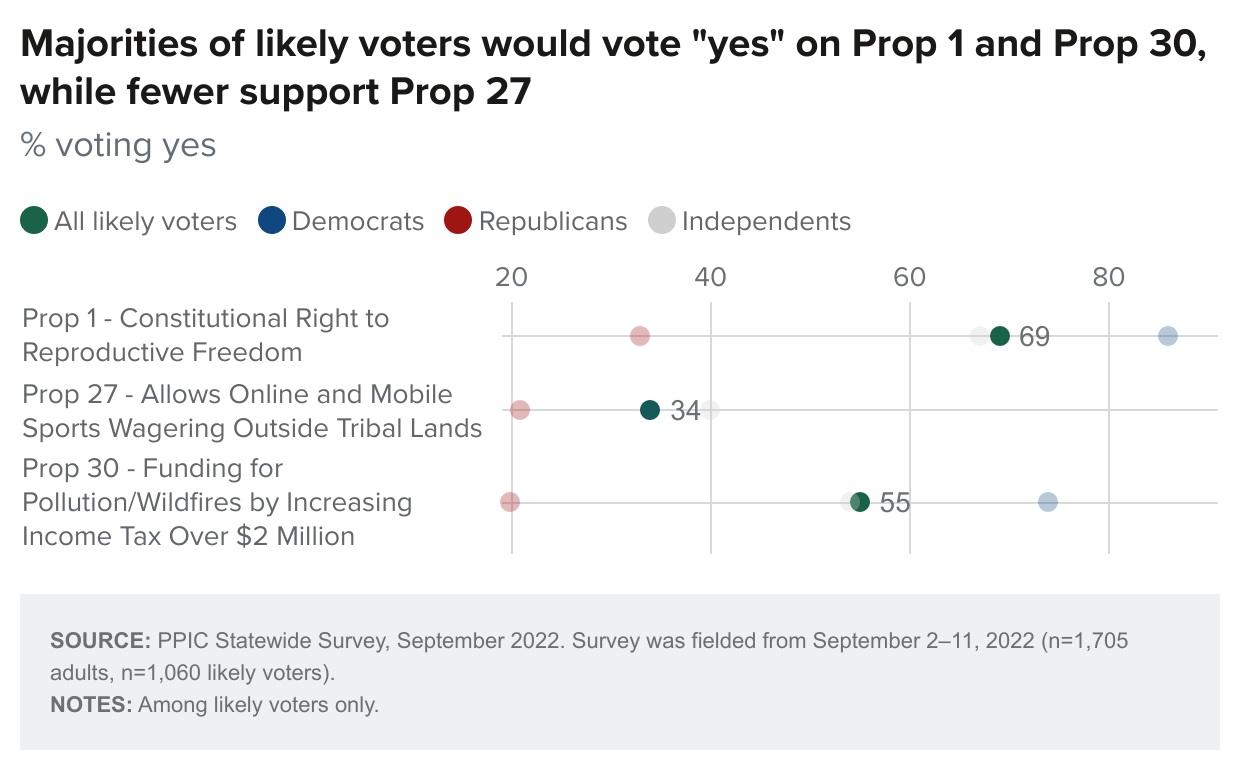
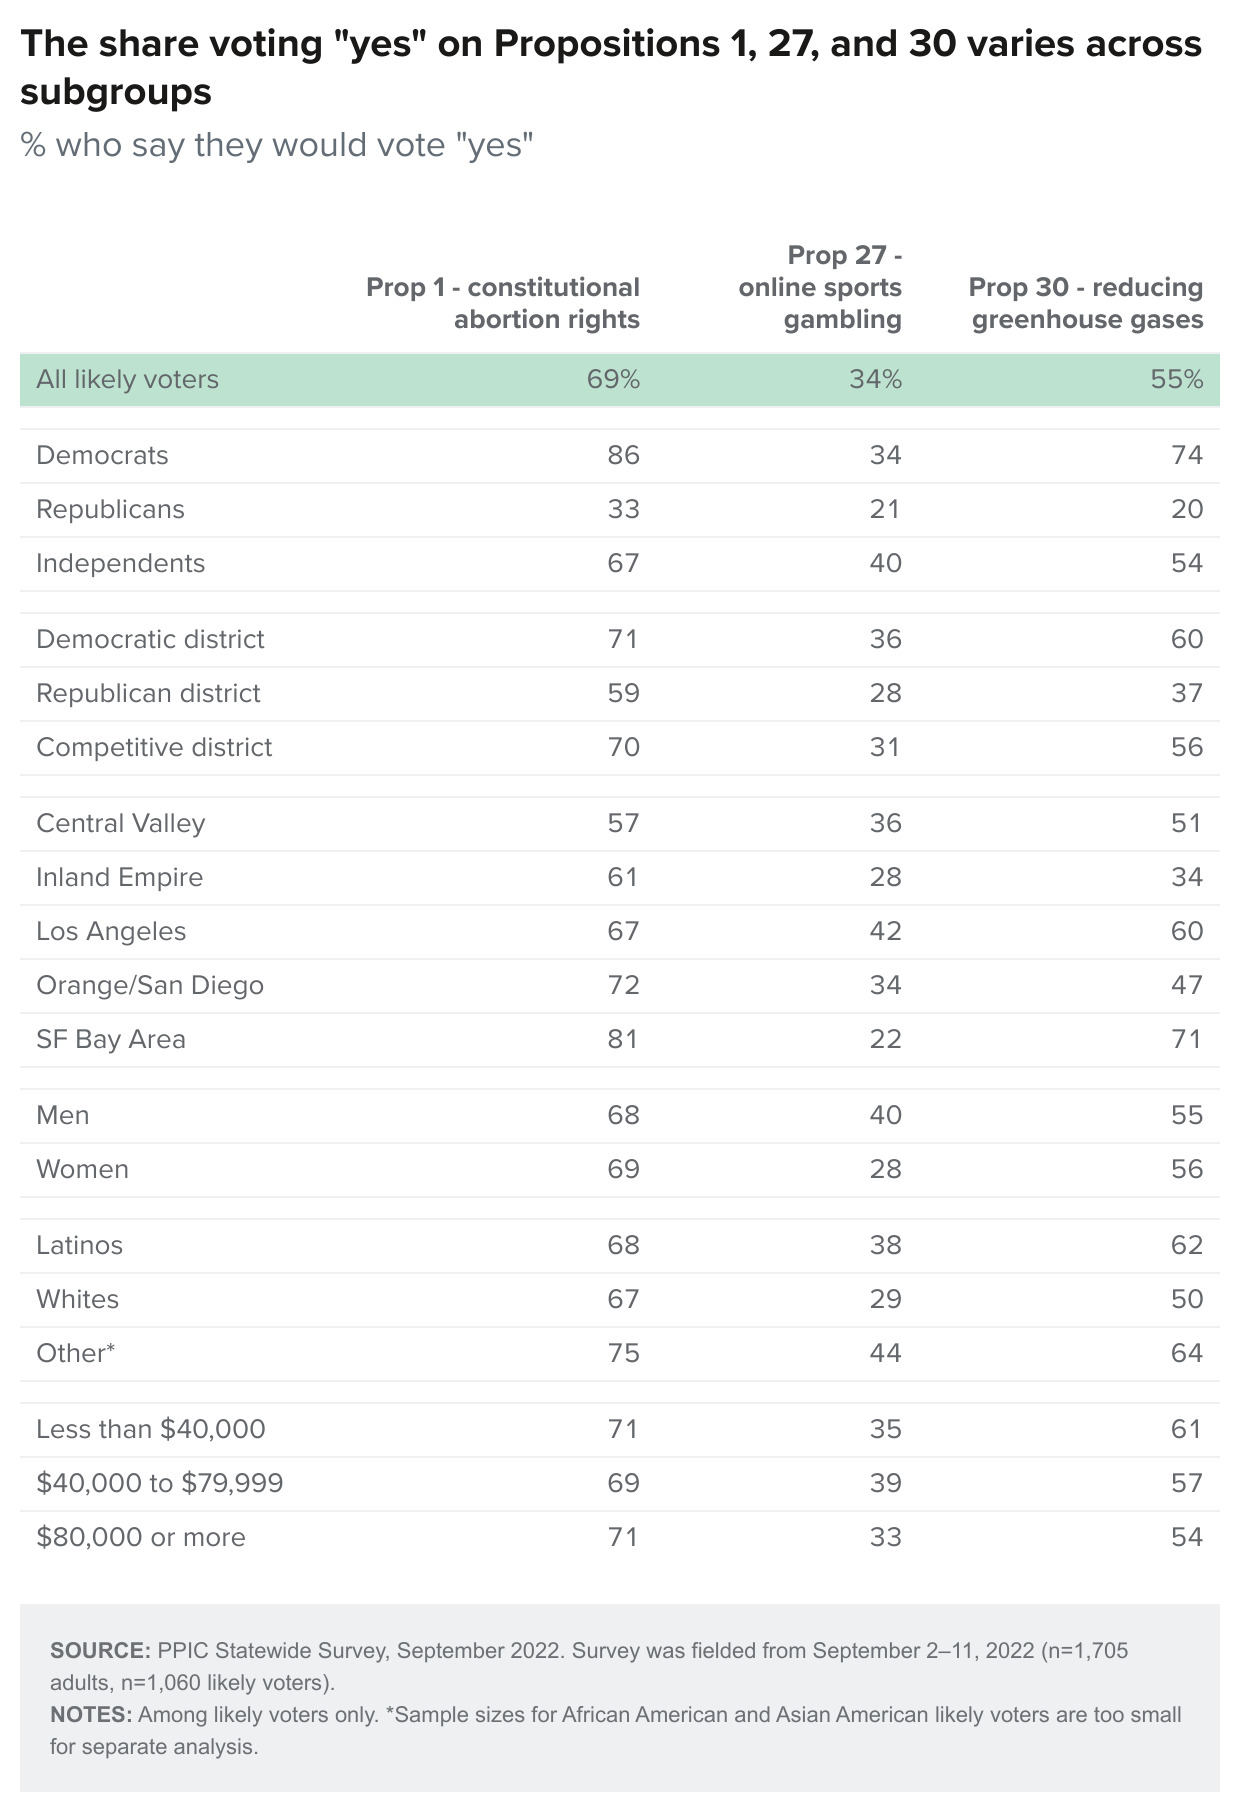
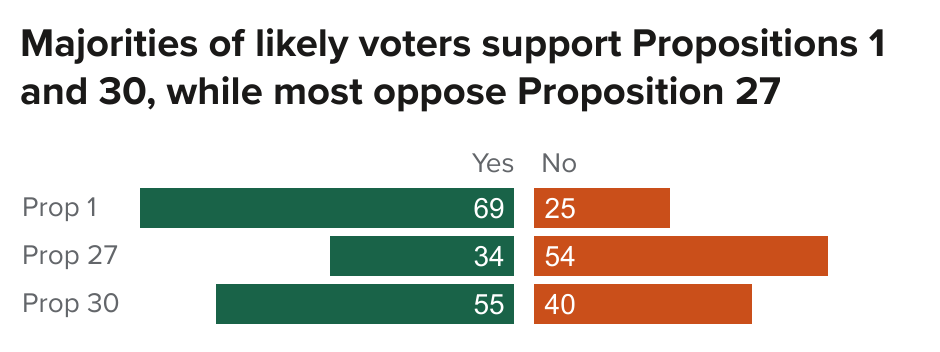 When likely voters are read the ballot title and labels, 69 percent would vote yes on Proposition 1 (constitutional abortion rights), 55 percent would vote yes on Proposition 30 (reducing greenhouse gases), and 34 percent would vote yes on Proposition 27 (online sports gambling). California likely voters are especially likely to say the outcome of Proposition 1 is very important to them; Democrats express this view far more often than Republicans or independents. →
- Six in ten likely voters would support the Democratic candidate in their US House race if the election were today. Forty-three percent say that voting this year is more important than in past midterm elections; 52 percent of Republicans and 45 percent of Democrats hold this view. Sixty-three percent say it is more important to them that House candidates work with the Biden administration and 33 percent say it is more important to push back against the Biden administration, with partisans deeply divided. →
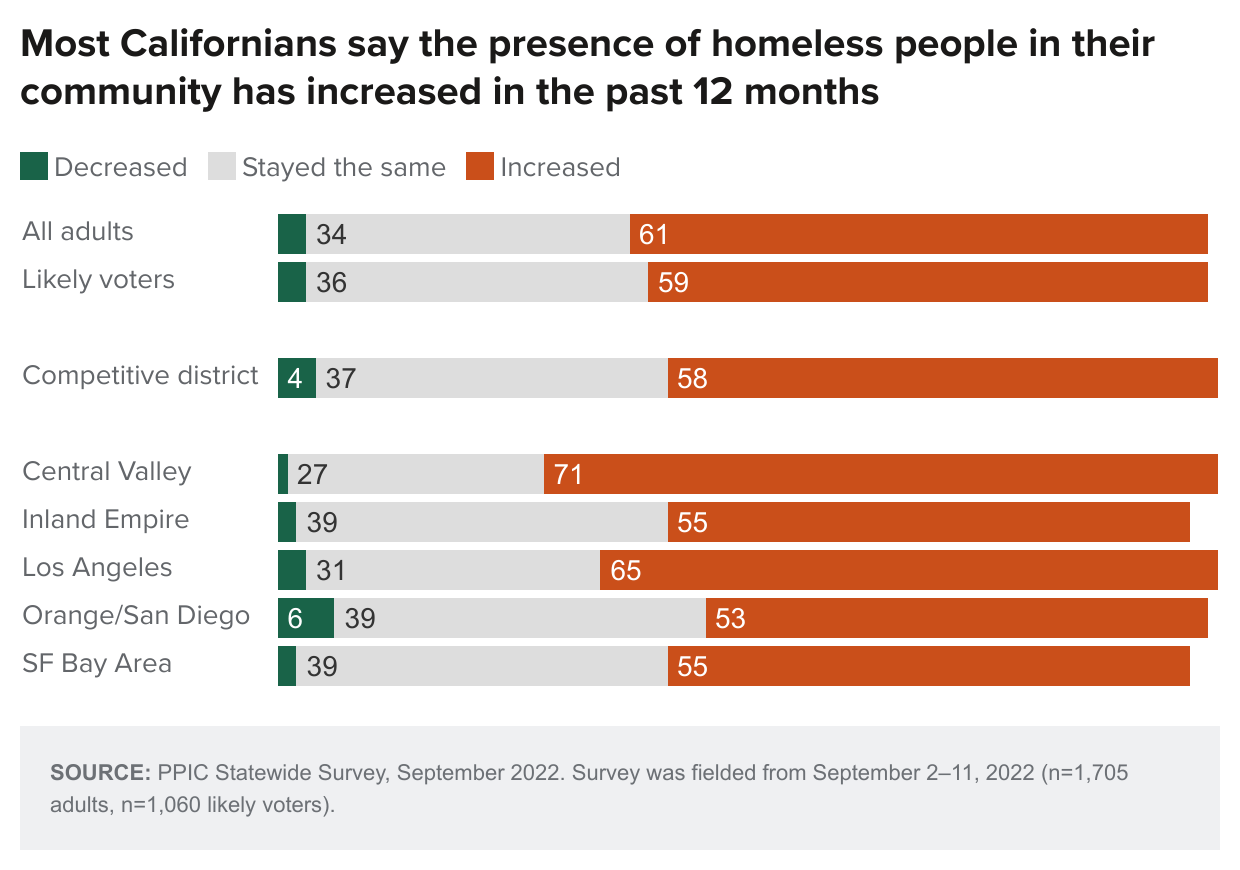
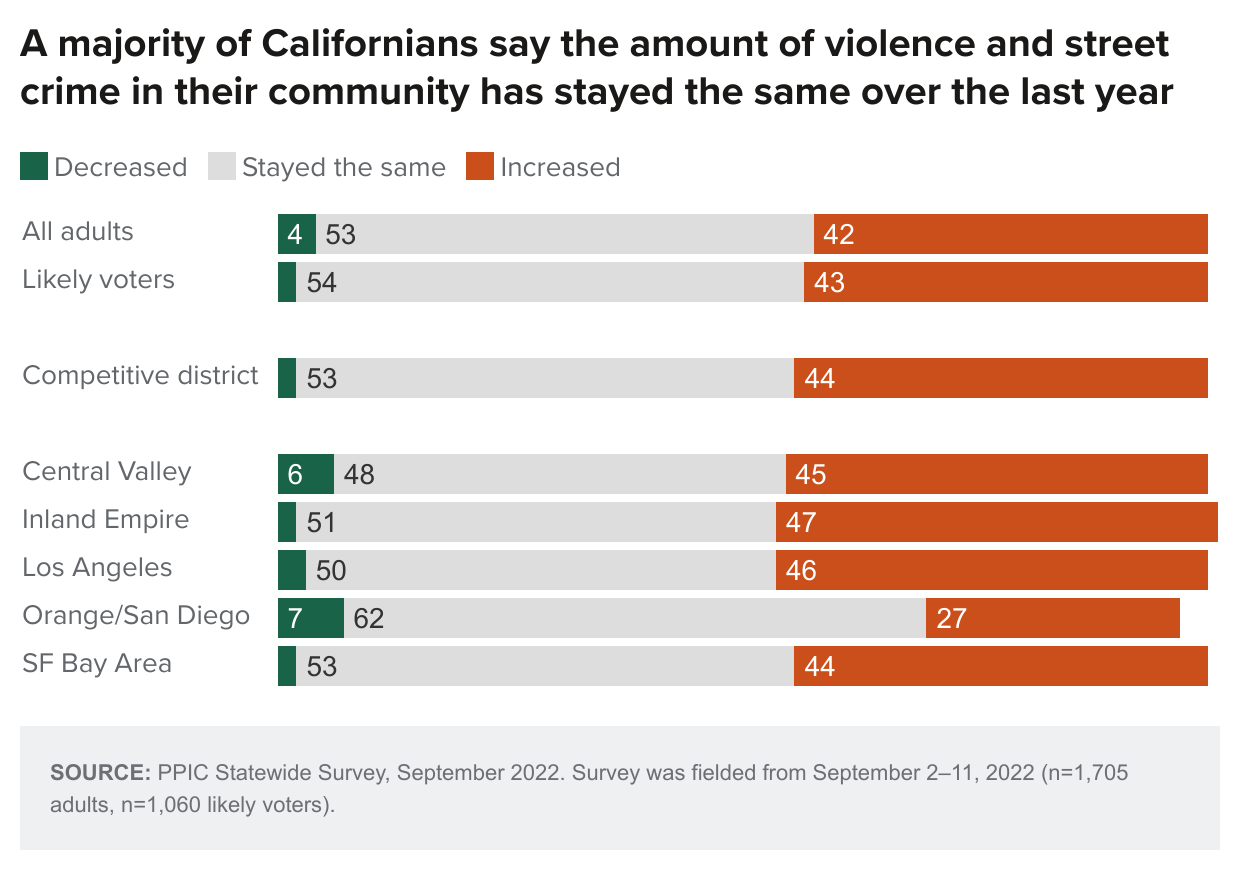
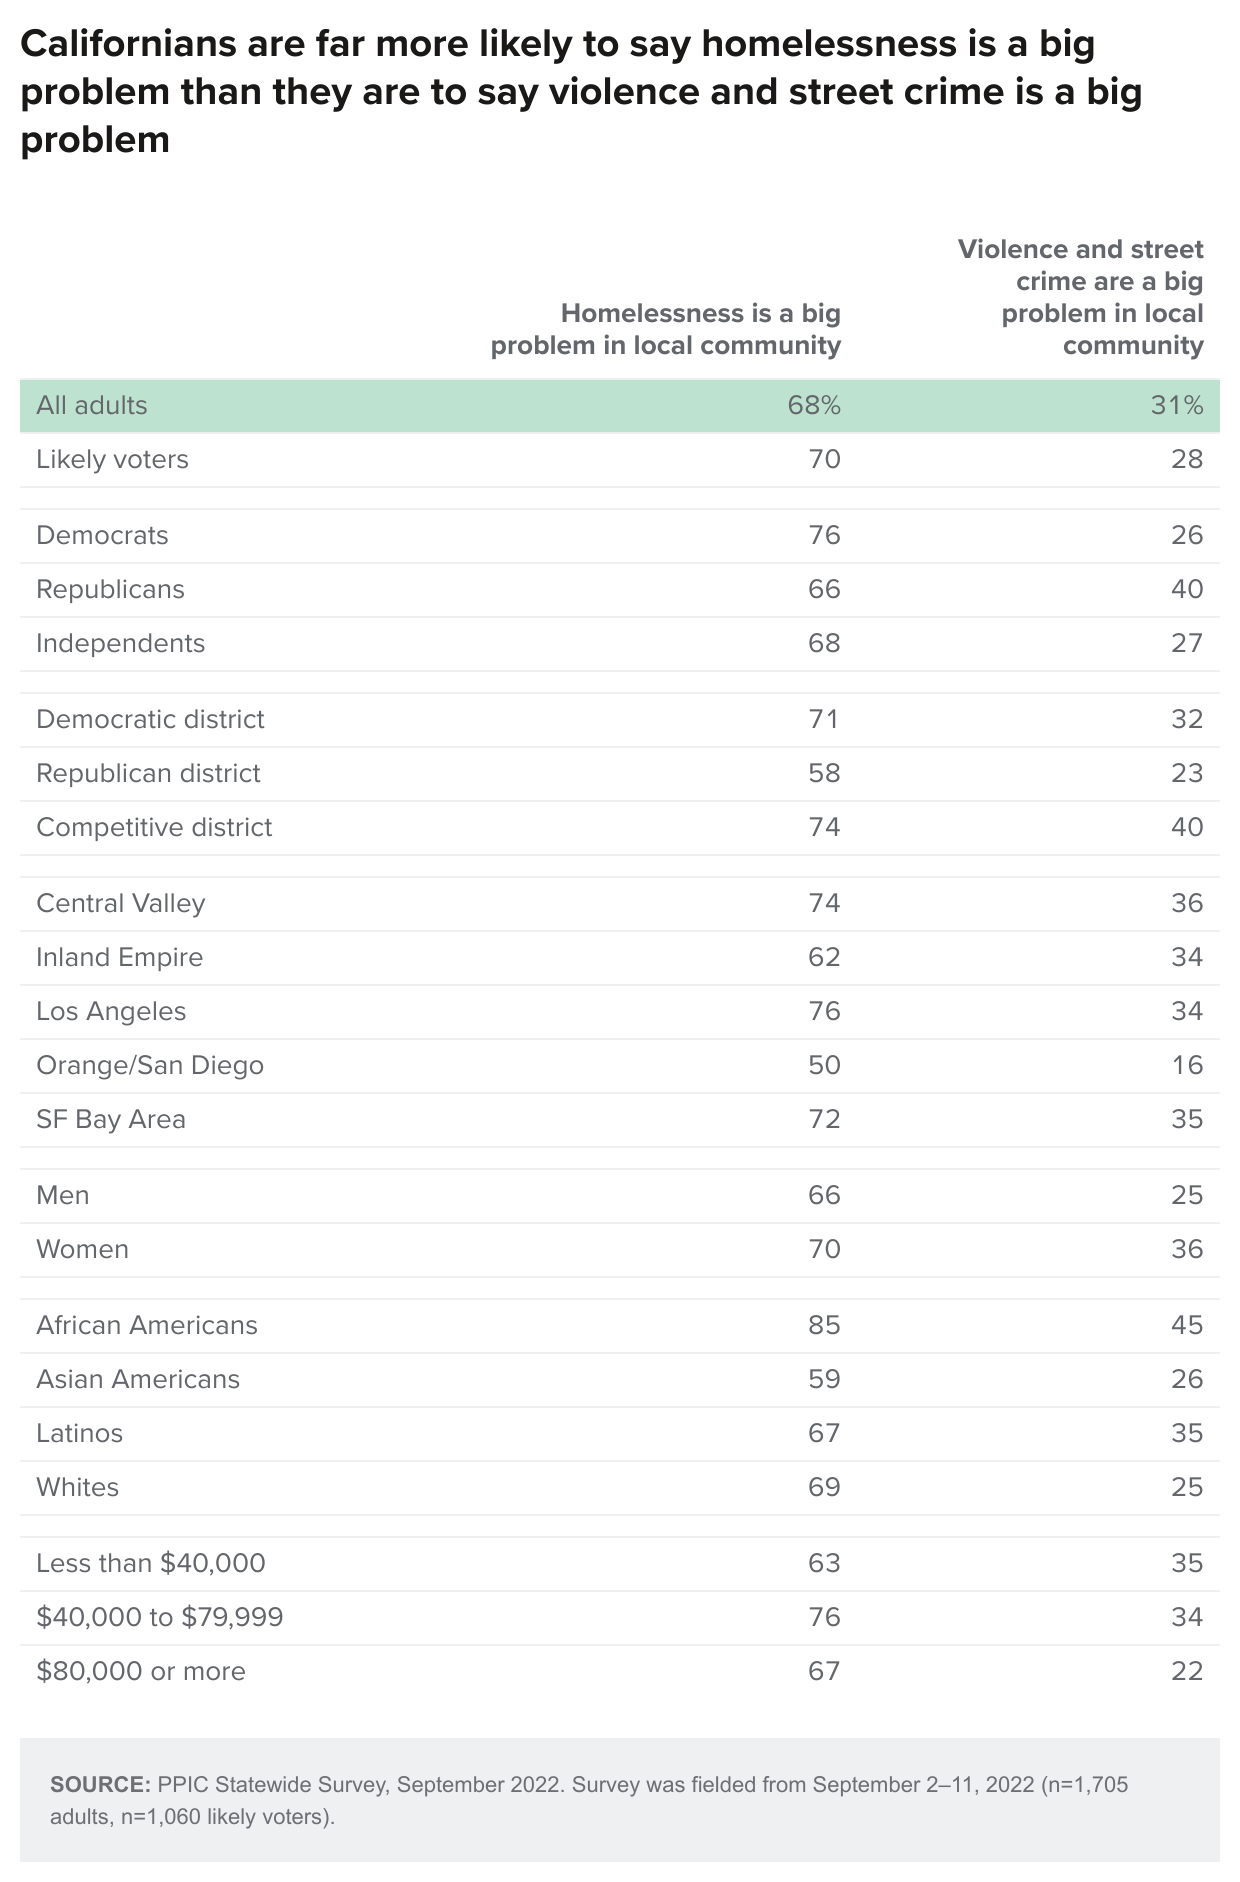
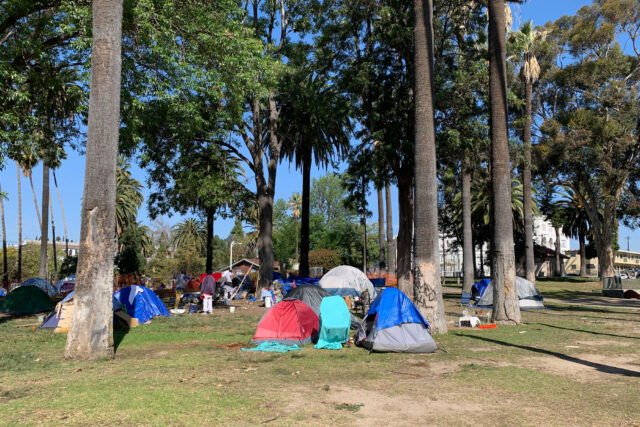
- At the local level, 68 percent of Californians say that homelessness is a big problem in their part of the state while 61 percent say the presence of the homeless has increased in their local community in the past year. Thirty-one percent of Californians say that violence and street crime is a big problem in their local community, and 42 percent say that local violence and street crime has increased in the past 12 months. →
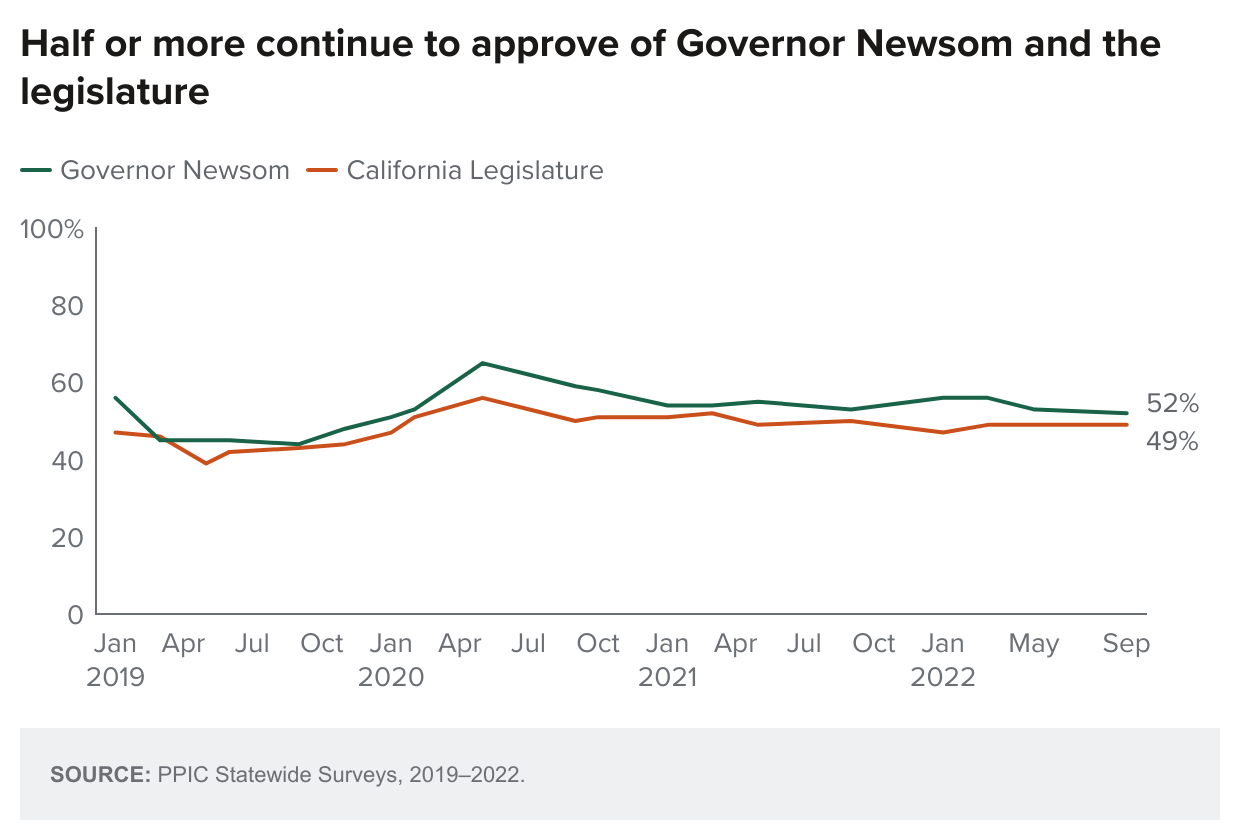
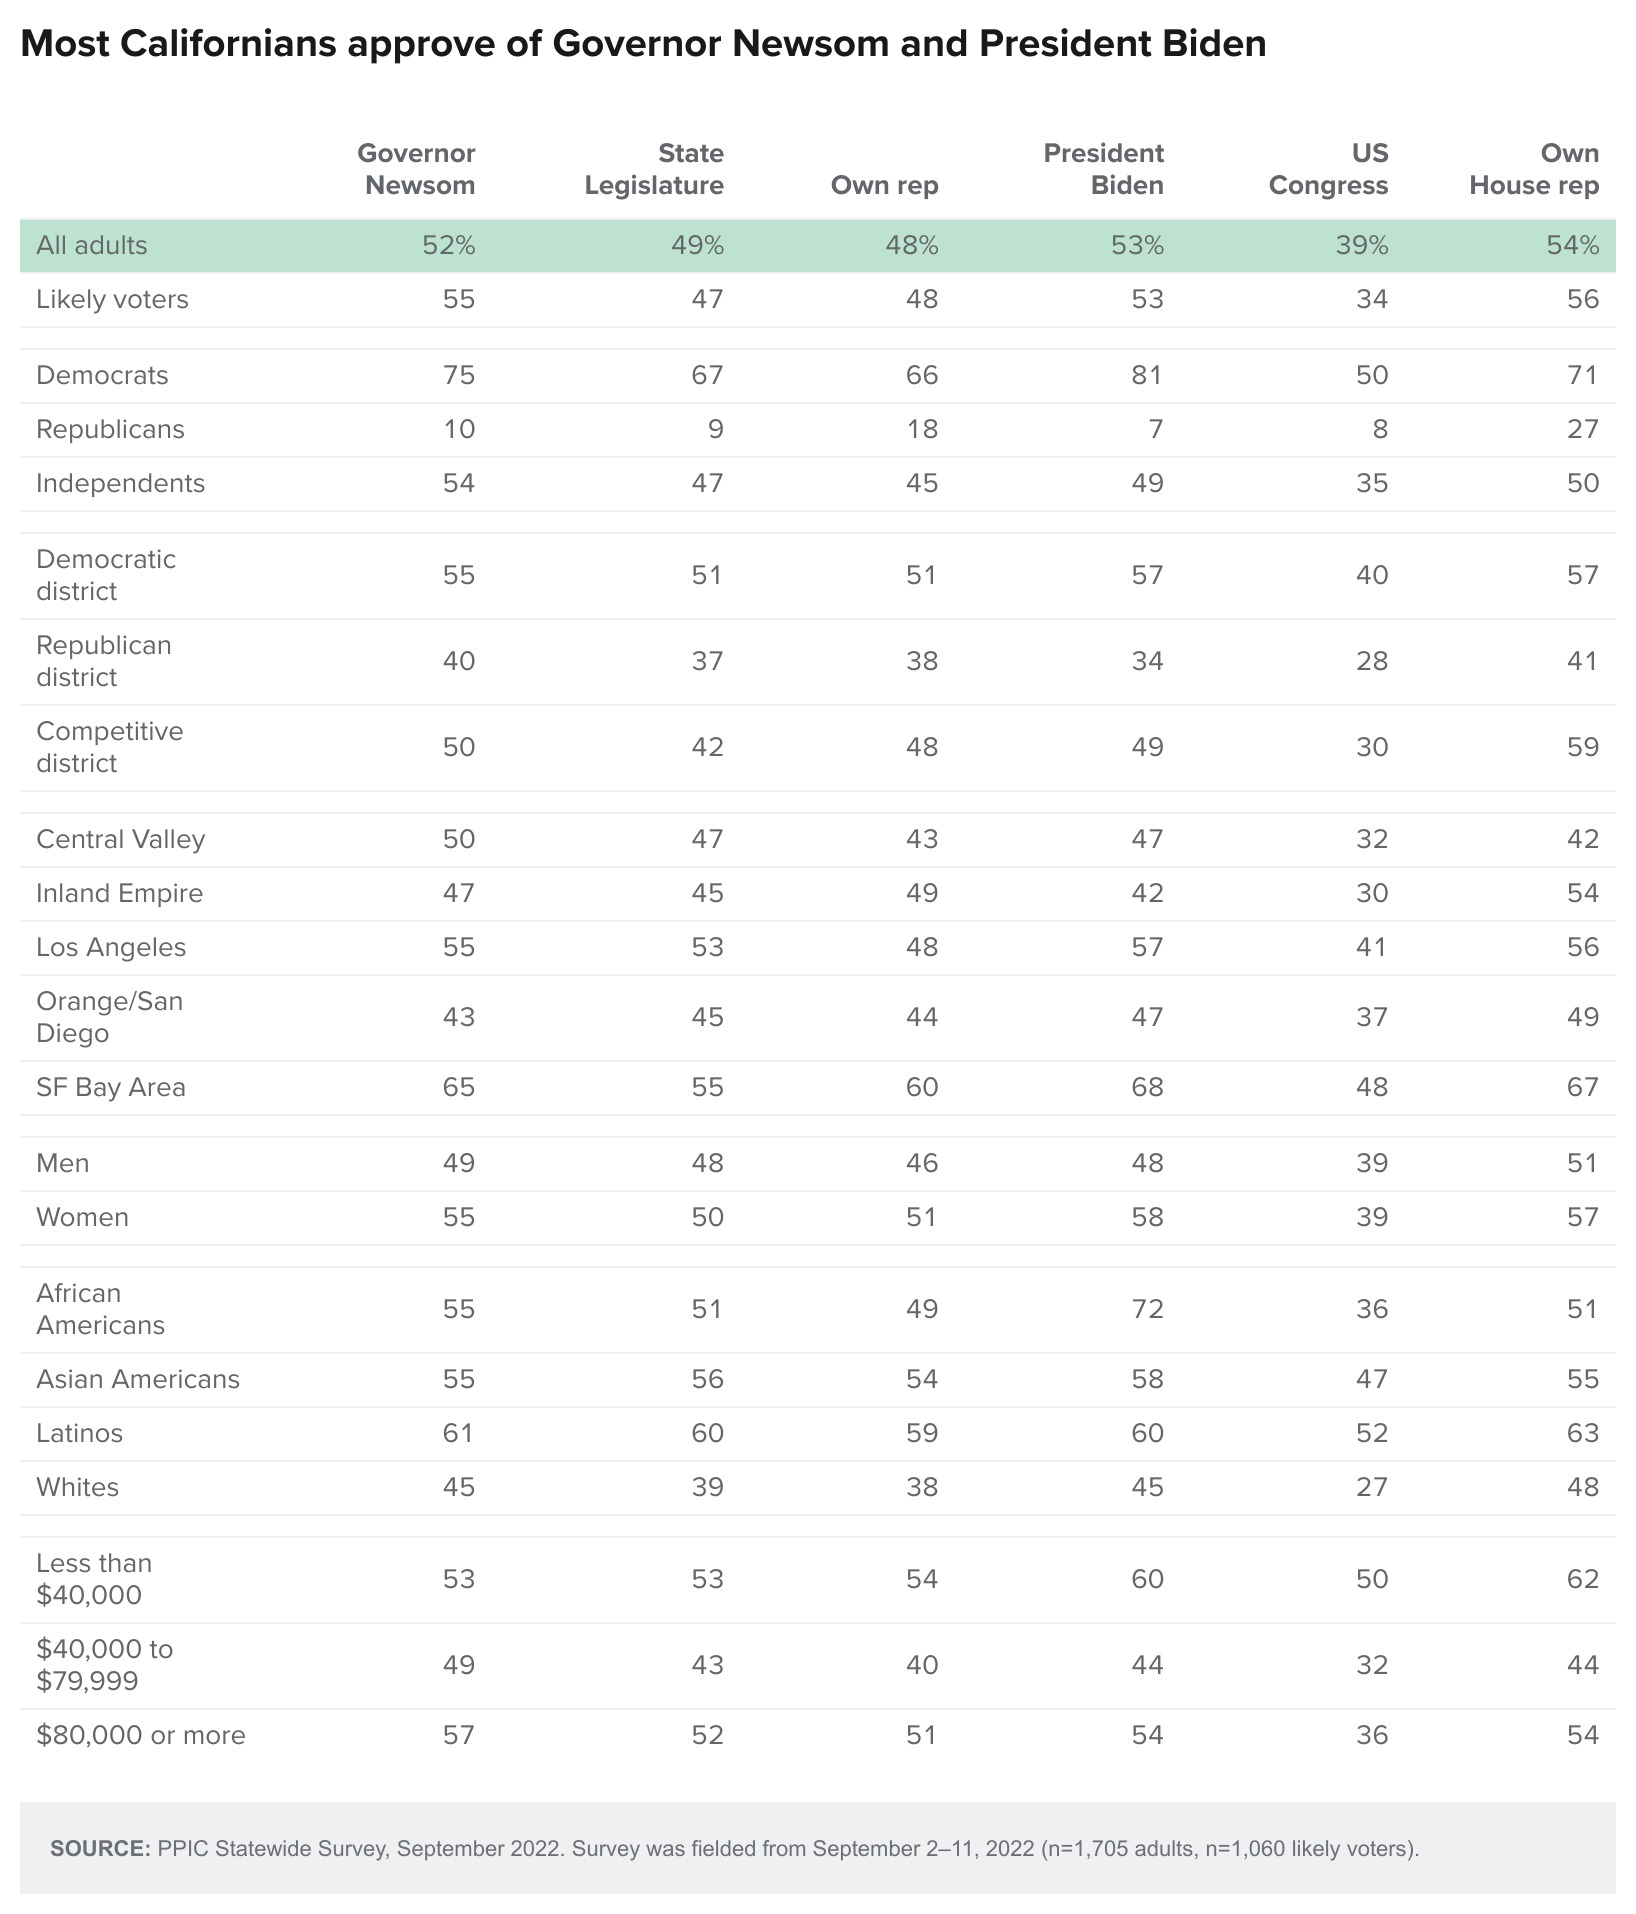
- Majorities of California adults and likely voters approve of Governor Gavin Newsom, President Joe Biden, and their US House representative. About half of California adults and likely voters also approve of the state legislature and their own state legislators, while fewer than four in ten approve of the US Congress. These approval ratings vary across partisan groups. →
Top Issues and Overall Mood
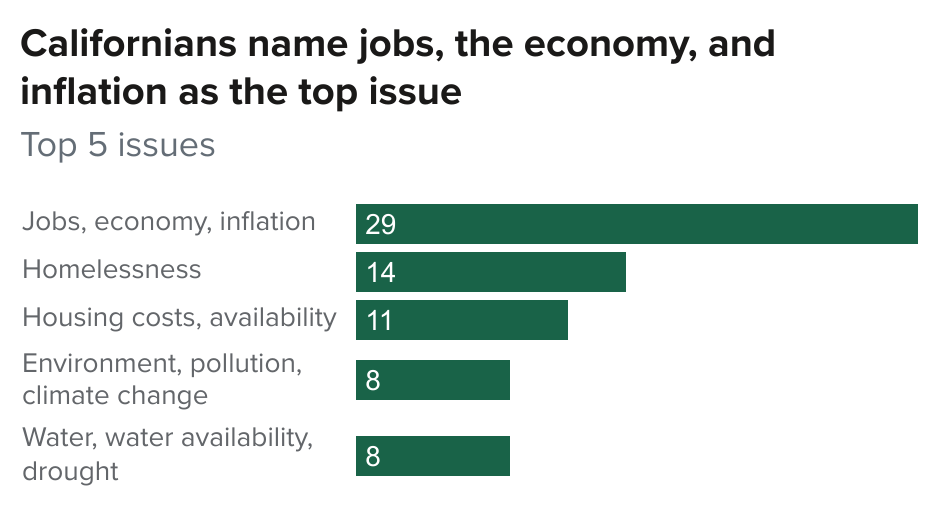
When asked to name the most important issue facing the state today, about three in ten Californians mention jobs, the economy, or inflation (29%), while fewer mention homelessness (14%), housing costs and availability (11%), the environment (8%), or water and drought (8%).
The rate of inflation has remained relatively high even while gas prices have fallen in recent months. In this context, an overwhelming majority of Californians continue to say they are experiencing financial hardship due to rising prices. Findings were similar in May (35% serious hardship; 29% hardship, but not serious) and March (35% serious hardship; 32% hardship, but not serious). The share saying that financial hardship is serious is higher among Latinos and African Americans and declines sharply with rising household income and higher educational attainment. Republicans (58%) are more than twice as likely as Democrats (25%) and far more likely than independents (37%) to say they are experiencing serious hardship. Across regions, the share experiencing serious hardship is highest in the Central Valley (46%) and lowest in the San Francisco Bay Area (27%).
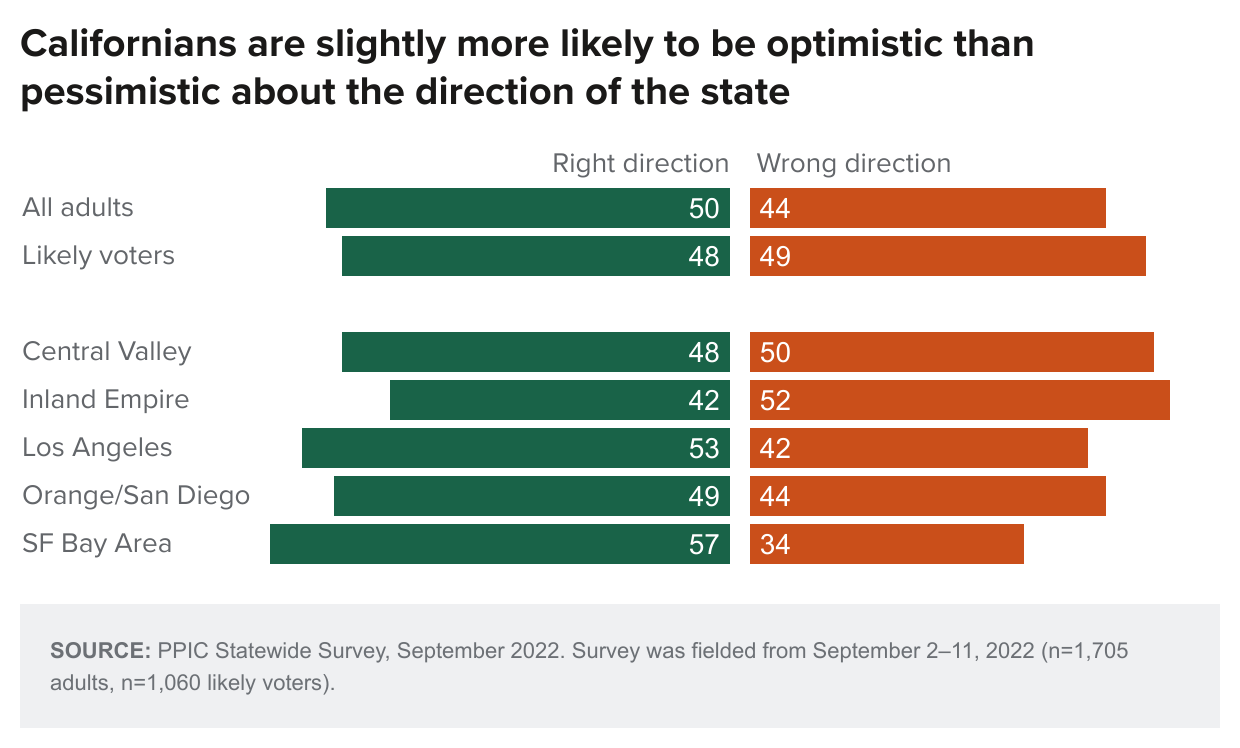
When asked about the general direction of the state, Californians are slightly more likely to be optimistic than pessimistic, with 50 percent saying the state is headed in the right direction (44% wrong direction). Likely voters are divided. In May, Californians were slightly more likely to be pessimistic than optimistic (50% wrong direction, 45% right direction). Today, residents in the Inland Empire are least optimistic and those in the San Francisco Bay Area are the most optimistic. There is a wide partisan divide: seven in ten Democrats (72%) are optimistic about the direction of the state, compared to fewer than half of independents (44%) and only one in ten Republicans (8%). Asian Americans (66%) are much more positive than African Americans (52%), Latinos (51%), and whites (43%) about the direction of the state.
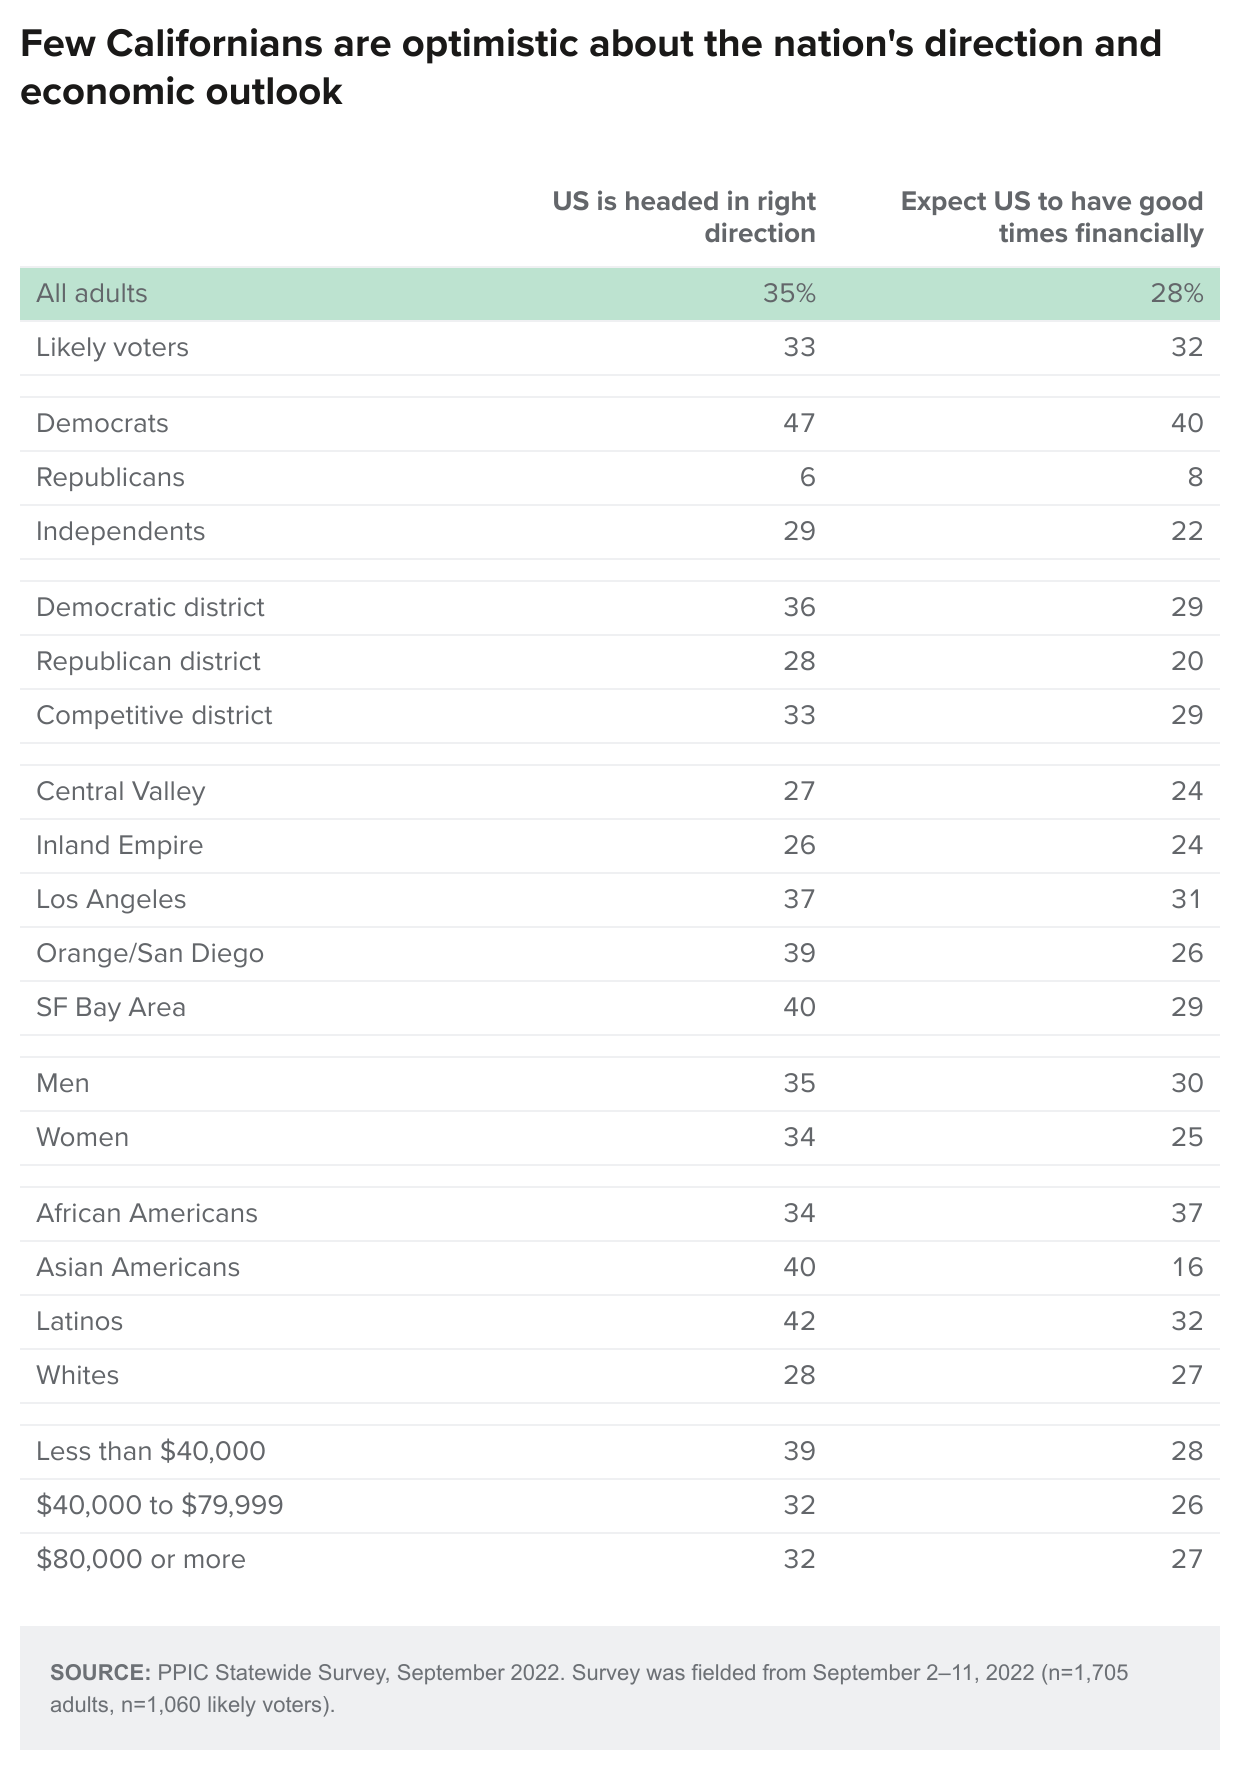
While half of Californians are optimistic about the direction of the state, about one in three adults say the United States is headed in the right direction. Sentiments today are nearly identical to May (30% right direction, 63% wrong direction). There is widespread agreement on this: about four in ten or fewer across regions and demographic groups are optimistic. Across parties, Democrats are divided (47% each), while few Republicans and independents are optimistic. Twenty-eight percent of Californians say they expect good times financially for the United States in the next 12 months—similar to perceptions in May (22%). Four in ten or fewer Californians across parties, regions, and demographic groups expect good times.
Gubernatorial Election
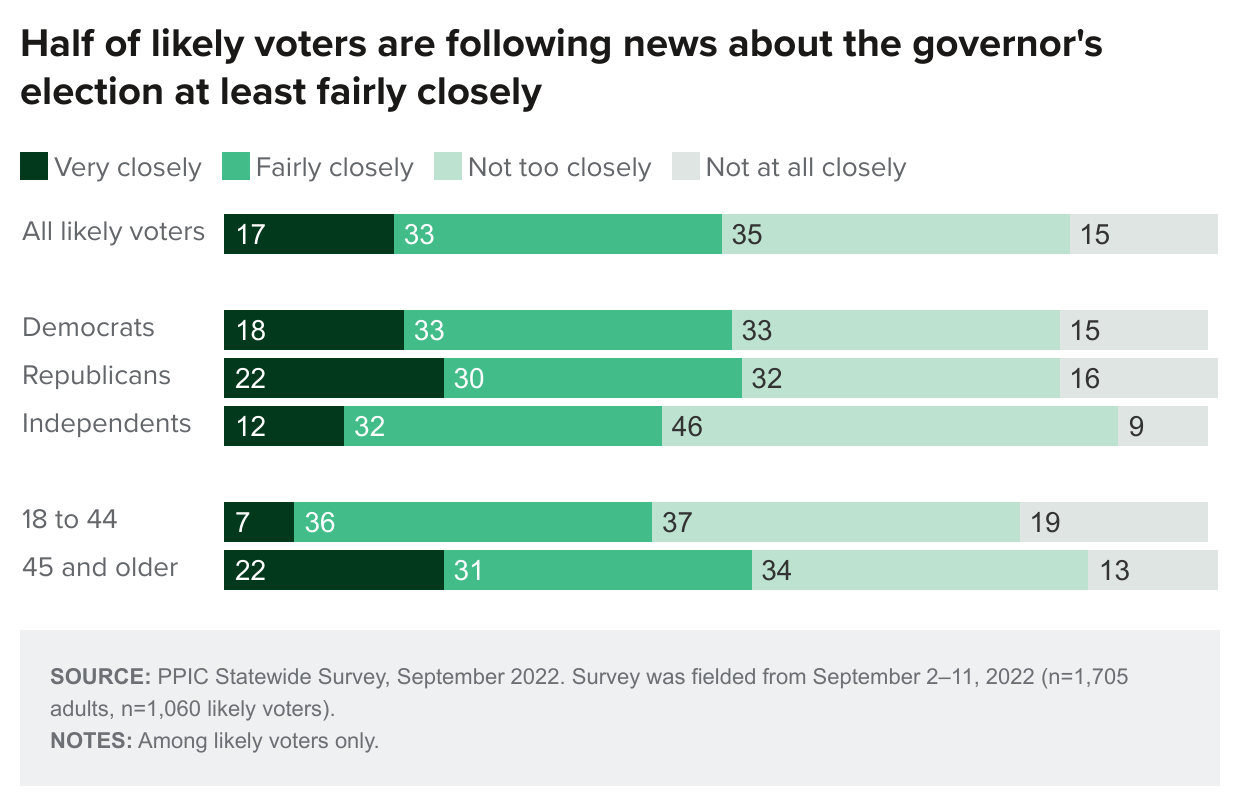
Half of likely voters say they are following news about the 2022 governor’s race very (17%) or fairly (33%) closely. More likely voters said this in September 2018, two months before the previous gubernatorial election (21% very, 41% fairly), and in September 2021 (40% very, 41% fairly), just prior to the special election on the recall of Governor Newsom. Today, more than four in ten across partisan groups and regions say they are following news about the gubernatorial election at least fairly closely, as do about half or more across demographic groups. Older likely voters (22% 45 and older) are three times as likely to say they are following the election very closely than are younger likely voters (7% 18 to 44). The share who are following the election very closely declines as educational attainment and income levels rise.
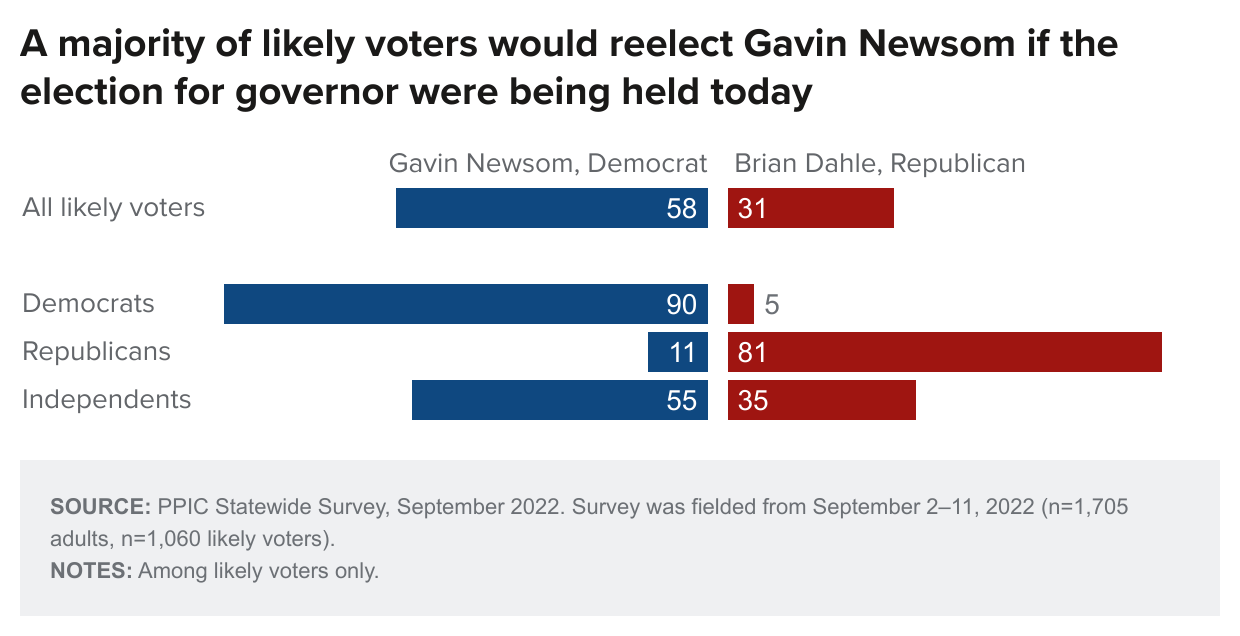
Democrat Gavin Newsom leads Republican Brian Dahle by a 27-point margin (58% to 31%) among likely voters, with about one in ten unsure of how they would vote (7%) or saying they would not vote in the race (5%) if the gubernatorial election were held today. Newsom enjoys the support of most Democrats (90%), while most Republicans (81%) support Dahle; independents favor Newsom (55% Newsom, 35% Dahle). Newsom receives majority support in the San Francisco Bay Area (72% Newsom, 20% Dahle) and Los Angeles (65% Newsom, 23% Dahle); likely voters in the Central Valley (50% Newsom, 42% Dahle), Orange/San Diego (46% Newsom, 40% Dahle), and the Inland Empire (41% Newsom, 38% Dahle) are divided. Newsom is favored across all age, gender, homeownership, income, and racial/ethnic groups; the share supporting Newsom increases as educational attainment rises (46% high school only; 56% some college; 66% college graduate).
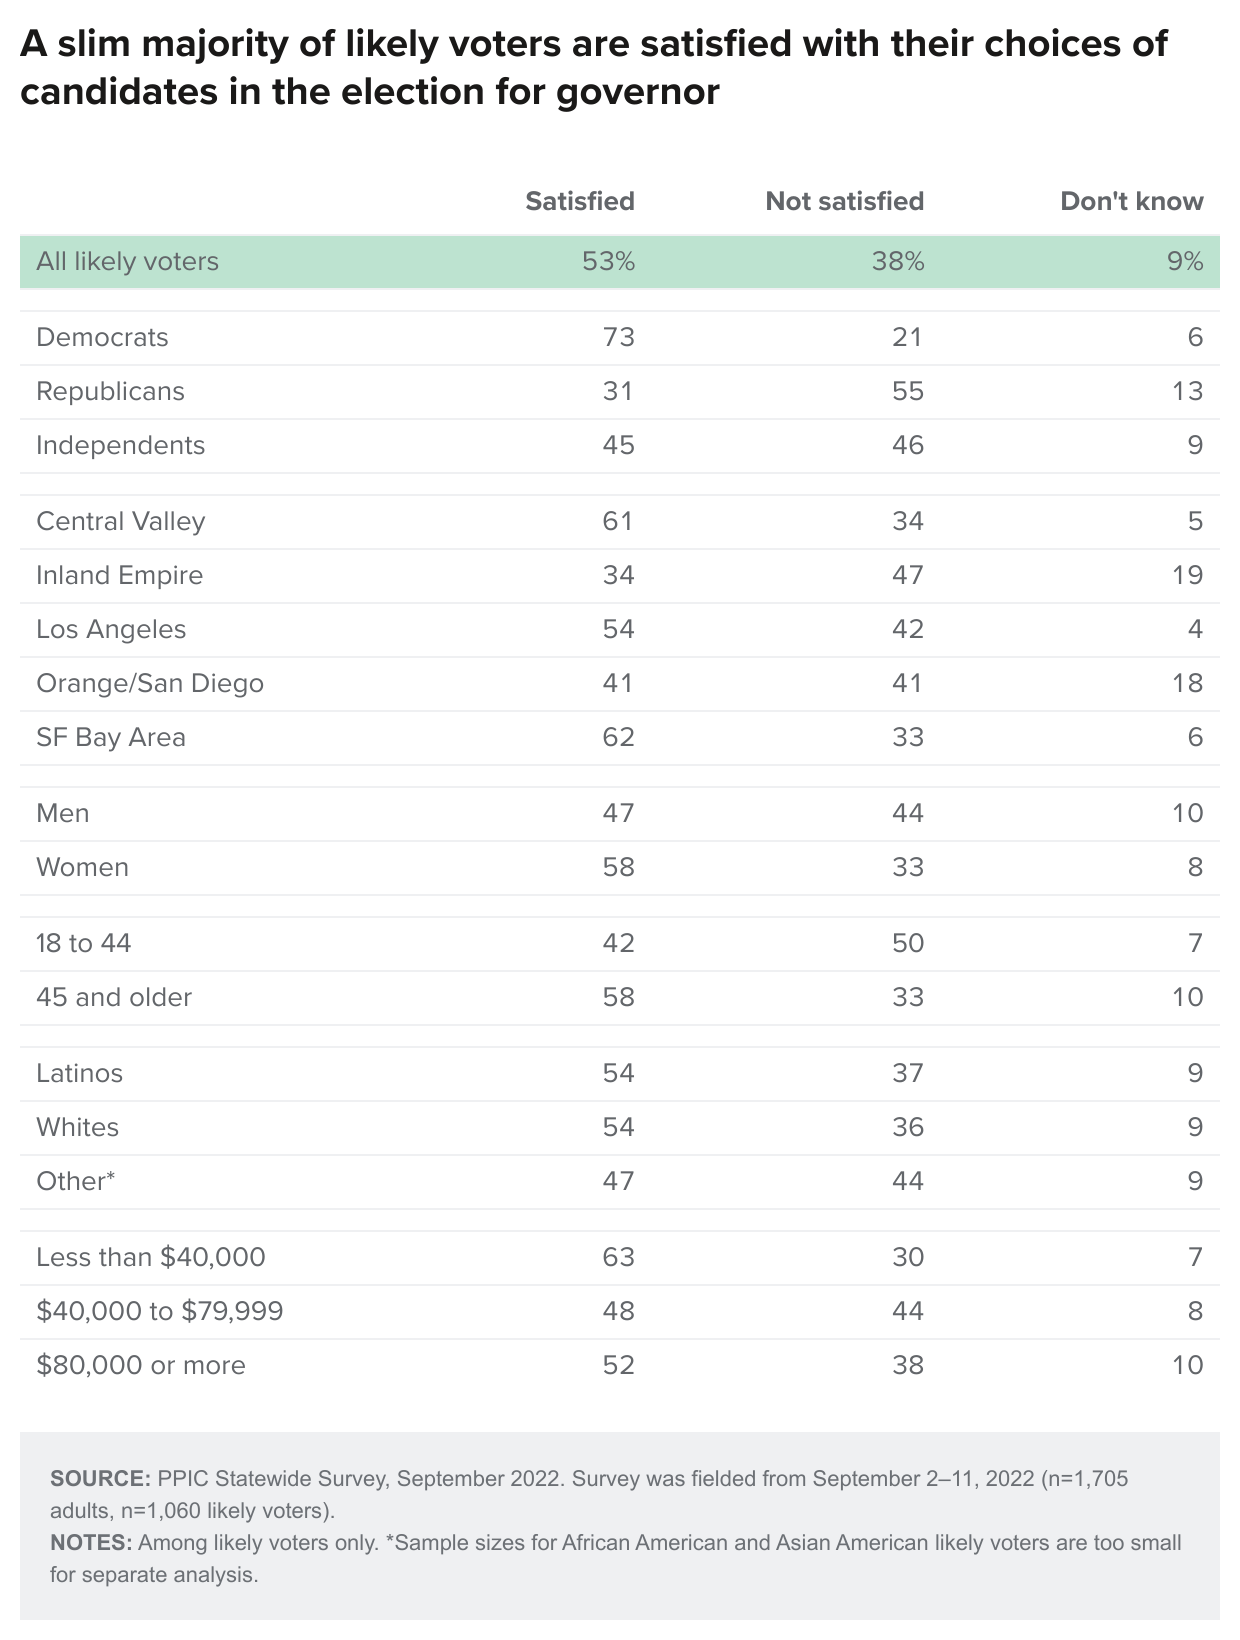
A slim majority of likely voters (53%) are satisfied with their choices of candidates in the election for governor, while nearly four in ten are not satisfied (38%). Shares holding these views were similar prior to the 2018 gubernatorial election. Today, satisfaction is far higher among Democrats than among Republicans or independents. Regionally, satisfaction is highest among likely voters in the San Francisco Bay Area, followed by those in the Central Valley, Los Angeles, Orange/San Diego, and the Inland Empire. About half or more likely voters across education, gender, homeownership, income, and racial/ethnic groups are satisfied with their choices of candidates for governor. Older likely voters are much more likely to be satisfied with their choices, while younger likely voters are divided.
State Propositions 1, 27, and 30
Voters will have their say on seven state propositions on the November ballot. Because of time constraints, our survey included only three higher-profile ballot measures: Propositions 1, 27, and 30. For each, we read the proposition number, ballot title, and ballot label.
If the election were held today, 69 percent of likely voters would vote “yes,” 25 percent would vote “no,” and 6 percent are unsure how they would vote on Proposition 1—the Constitutional Right to Reproductive Freedom. Placed on the ballot by the state legislature, this measure would amend the California Constitution to include the fundamental right to choose to have an abortion and the fundamental right to choose or refuse contraceptives. Strong majorities of Democrats (86%) and independents (67%) would vote “yes,” while 61 percent of Republicans would vote “no.” Majorities across the state’s major regions and demographic groups say they would vote “yes.”
If the election were held today, 34 percent of likely voters would vote “yes,” 54 percent would vote “no,” and 12 percent are unsure on Proposition 27—Allows Online and Mobile Sports Wagering Outside Tribal Lands. This citizens’ initiative would allow Indian tribes and affiliated businesses to operate online and mobile sports wagering outside tribal lands. Among partisans, a strong majority of Republicans would vote “no,” compared to half of Democrats and independents. Regionally, majorities in the Inland Empire, Orange/San Diego, and the San Francisco Bay Area would vote “no,” while likely voters in the Central Valley and Los Angeles are divided. At least half across most demographic groups would vote “no.” Likely voters age 18 to 44 (52%) and renters (51%) are the only two demographic groups with a slim majority voting “yes.”
If the election were held today, 55 percent of likely voters would vote “yes,” 40 percent would vote “no,” and 5 percent are unsure on Proposition 30—Provides Funding for Programs to Reduce Air Pollution and Prevent Wildfires by Increasing Tax on Personal Income Over $2 Million. This citizens’ initiative would increase taxes on Californians earning more than $2 million annually and allocate that tax revenue to zero-emission vehicle purchase incentives, vehicle charging stations, and wildfire prevention. A majority of Democrats and independents would vote “yes,” while an overwhelming majority of Republicans would vote “no.” Regionally, majorities in the Central Valley, Los Angeles, and the San Francisco Bay Area would vote “yes,” while most in the Inland Empire would vote “no”; likely voters in Orange/San Diego are divided. Half of more across age, education, gender, homeownership, and income groups would vote “yes.”
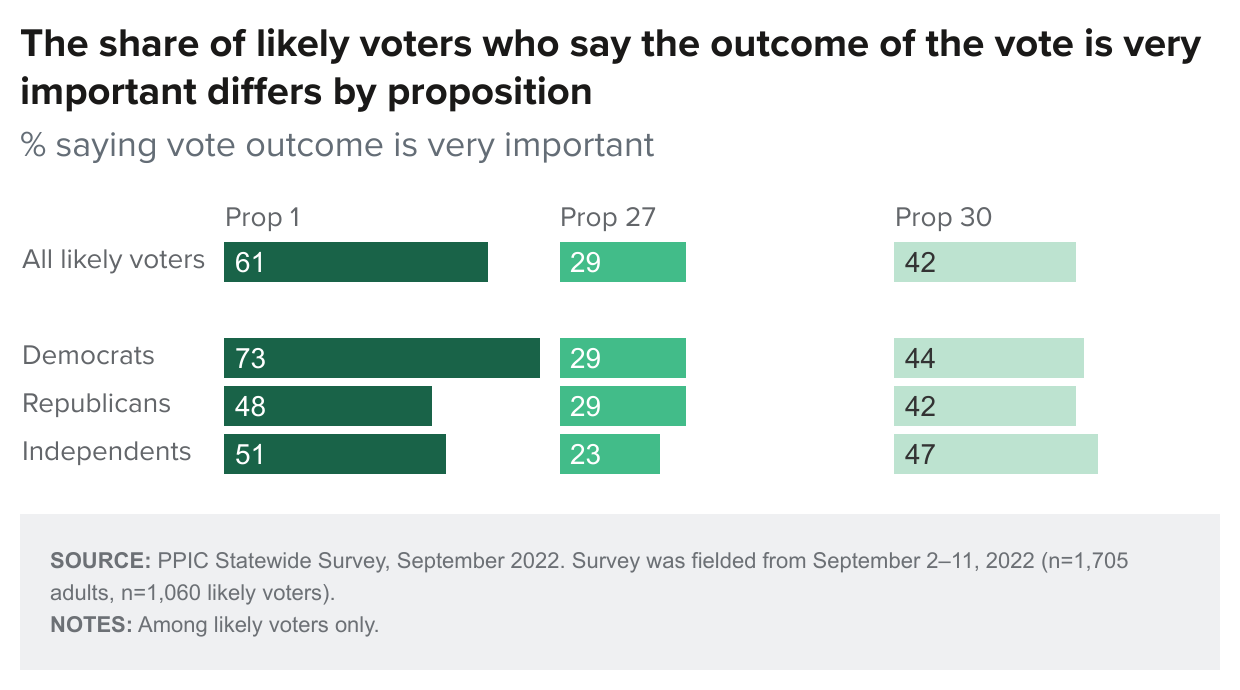
When asked how important the outcome of the vote on each of these three state propositions is to them, 61 percent of likely voters say the outcome of Prop 1 is very important; 42 percent say the same about Prop 30, while 29 percent say the outcome of Prop 27 is very important. An overwhelming majority of Democrats say the result of Prop 1 is very important, compared to about half of Republicans and independents. About half or more across regions as well as demographic groups hold this view. Fewer than four in ten across all regions and partisan and demographic groups think the outcome of Prop 27 is very important. The outcome of Prop 30 is very important to at least four in ten across partisan groups. Regionally, about half in Los Angeles and the San Francisco Bay Area say it is very important, compared to fewer likely voters elsewhere. While a third or more likely voters across all demographic groups hold this view, shares vary across subgroups.
Congressional Elections
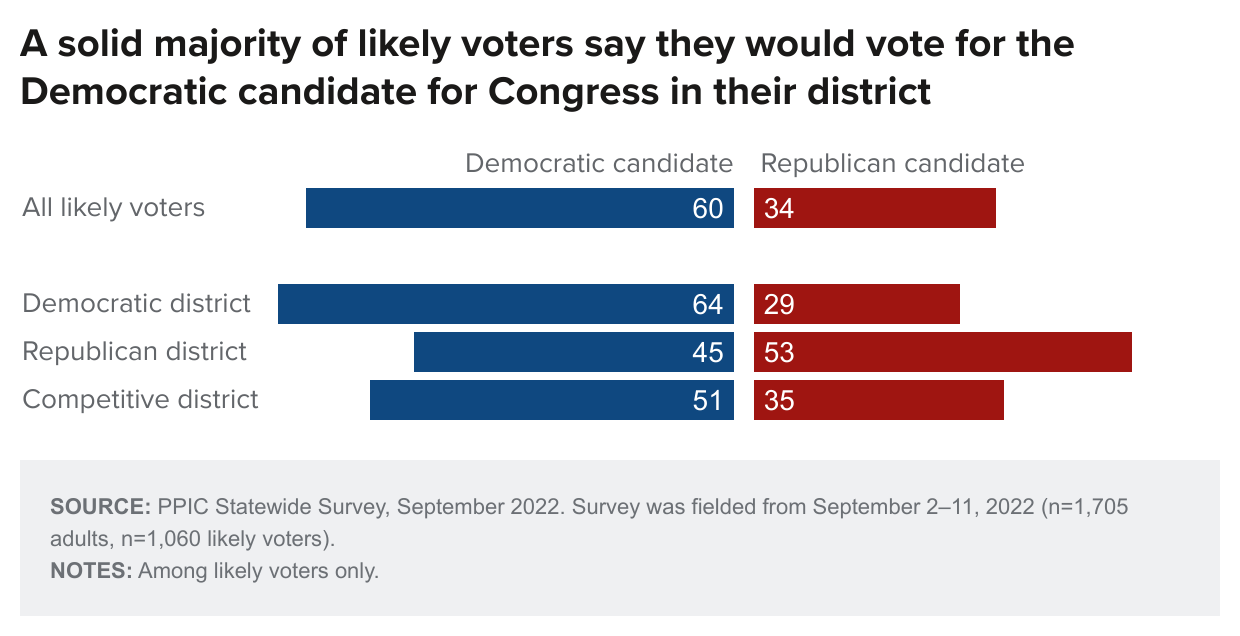
When asked how they would vote if the 2022 election for the US House of Representatives were held today, 60 percent of likely voters say they would vote for or lean toward the Democratic candidate, while 34 percent would vote for or lean toward the Republican candidate. In May, likely voters preferred the Democratic candidate by a similar margin (55% Democrat/lean Democrat, 35% Republican/lean Republican). An overwhelming majority of partisans support their party’s candidate, while independents are more likely to prefer the Democratic candidate (58% Democrat/lean Democrat, 33% Republican/lean Republican). Democratic candidates are preferred by a 35-point margin in Democratic-held districts, while Republican candidates are preferred by an 8-point margin in Republican-held districts. In the ten competitive California districts as defined by the Cook Political Report, the Democratic candidate is preferred by a 16-point margin (51% to 35%).
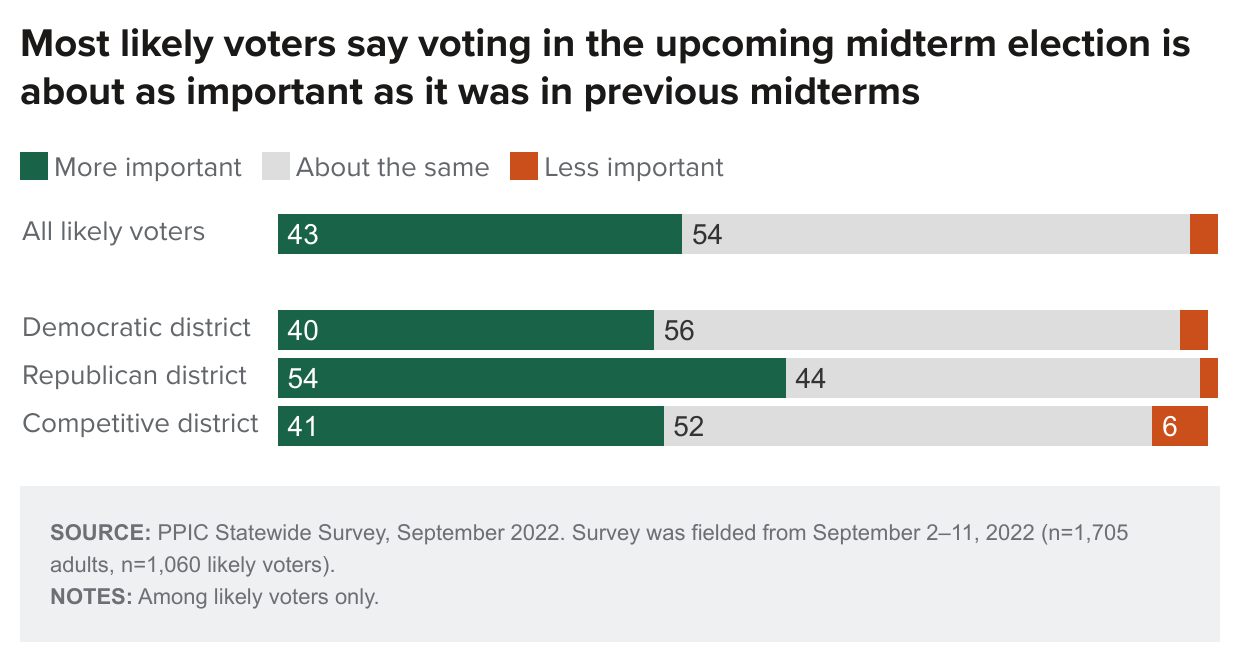
When asked about the importance of voting this year compared to past midterm elections, 43 percent of likely voters say it is more important, while slightly more than half say voting is about as important as in past years; only 3 percent feel it is less important. Likely voters are as likely to say voting in this election is more important as they were in March 2022 (42%) but are less likely to say this than they were prior to the last midterm election in September 2018 (52%). Today, Republican likely voters (52%) are slightly more likely than Democrats (45%) and independents (37%) to say voting in this election is more important. Likely voters in Republican-held districts are much more likely than those in Democratic-held districts and those in competitive districts to say voting is more important.
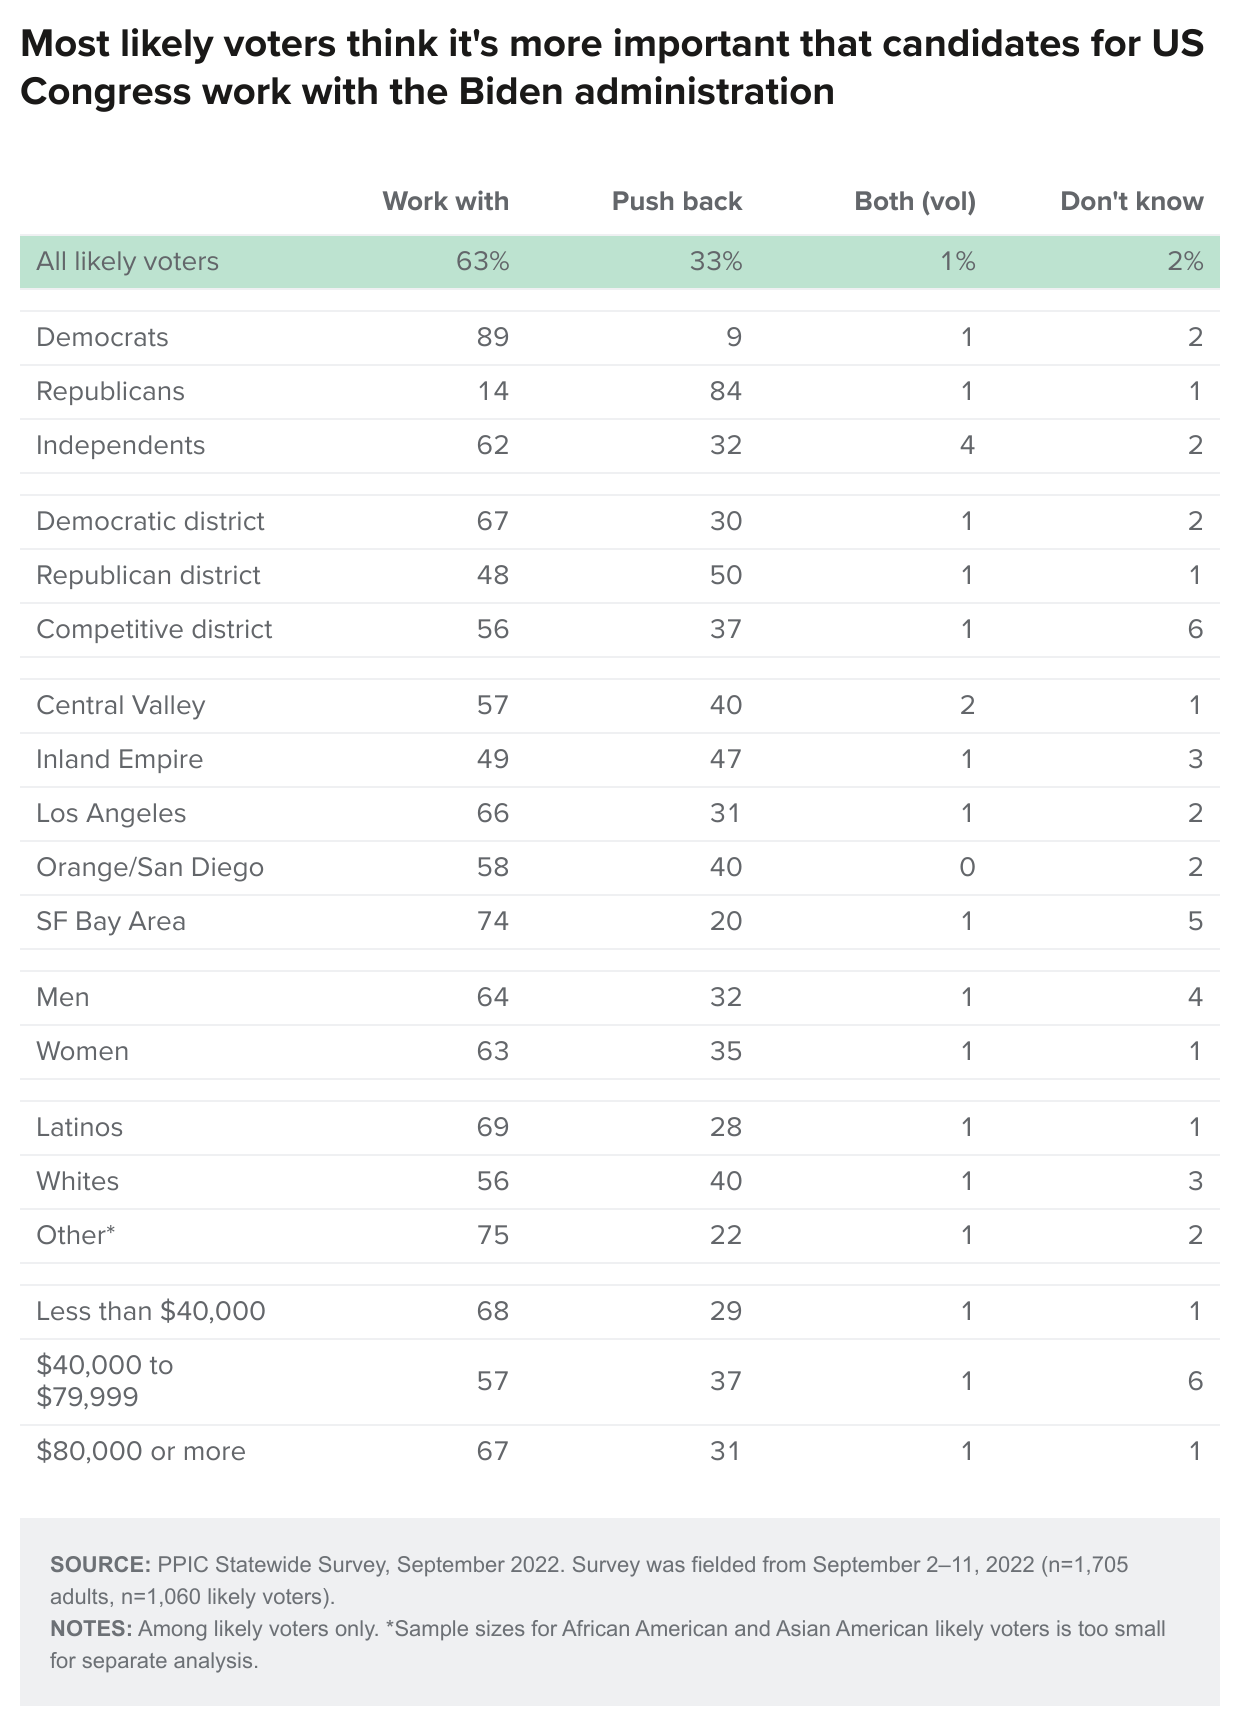
Likely voters are far more likely to say they prefer US congressional candidates who are willing to work with the Biden administration (63%) rather than those who push back against the Biden administration (33%). In October 2018, likely voters were divided on whether candidates for US Congress should work with (45%) or push back against the Trump administration (48%). Today, partisan likely voters are divided: nine in ten Democrats prefer House candidates who would work with the Biden administration, while more than eight in ten Republicans prefer House candidates who push back against the Biden administration. About six in ten independents prefer that House candidates work with the Biden administration. Two in three likely voters in Democratic-held districts prefer House candidates who would work with Biden, while likely voters in Republican-held districts are divided (48% work with, 50% push back); nearly six in ten likely voters in competitive districts have a preference for a candidate working with (56%) rather than pushing back (37%).
Local Election Issues: Homelessness and Crime
Most Californians say homelessness is at least somewhat of a problem in their community, and strong majorities say it is a big problem (68% adults, 70% likely voters); one in ten adults and likely voters say it is not much of a problem. Seven in ten or more adults in Democratic congressional districts (71%) or competitive congressional districts (74%) say homelessness is a big problem, compared to a smaller majority in Republican congressional districts (58%).
About six in ten adults and likely voters say the presence of homeless people in their community has increased in the last year; about one in three say it has stayed the same, and few say it has decreased. The share noting an increase has remained similar since the first time PPIC asked this question in November 2019. Today, majorities of adults in all types of congressional districts say there has been an increase (62% Democratic congressional districts, 53% Republican congressional districts, 58% competitive congressional districts). Majorities across almost all partisan, age, education, gender, income, and racial/ethnic groups—with the exception of Asian Americans (48%) —hold this view. Residents in the Central Valley and Los Angeles are more likely than residents in other parts of California to say the presence of homeless people in their community has increased.
Nearly two in three adults and likely voters say crime and street violence are at least somewhat of a problem in their local community, including about three in ten who say it is a big problem (31% adults, 28% likely voters). The share of adults saying crime is a big problem was similar in February (34%). Forty percent of adults in competitive congressional districts see crime as a big problem (32% Democratic congressional district, 23% Republican congressional district).
About four in ten adults and likely voters say that violence and street crime has increased during the past year; slim majorities say it has stayed the same, and few say it has decreased. Among partisans, Democrats (60%) and independents (53%) are more likely to say it has stayed the same, while Republicans (60%) are more likely to say it has increased. Fewer than half of adults in competitive districts say there has been an increase (42% each in Democratic and Republican congressional districts, 44% in competitive districts). Fewer than half across age, education, gender, and income groups say this. More than four in ten across most regions note an increase—the exception is Orange/San Diego, where 27 percent say violence and street crime has increased. The share saying there has been an increase in local violence and street crime declines with rising education and increases with age.
Approval Ratings
A majority of adults (52%) and likely voters (55%) approve of the way Governor Newsom is handling his job, while 35 percent of adults and 42 percent of likely voters disapprove. Approval was similar in September 2021 (53% adults and likely voters), and has been 50 percent or more since before the pandemic. Today, as in the past, there is a partisan divide. Majorities of Democrats and independents approve of Newsom, while most Republicans disapprove. Half of residents in competitive congressional districts approve of Newsom. About half or more across most demographic groups approve, with the exception of adults with some college education and whites (45% each). Across regions, majorities approve only in the San Francisco Bay Area and Los Angeles. Nearly half of adults and likely voters approve of the way the state legislature is handling its job, similar to a year ago.
A plurality of adults and likely voters approve of the job that the state legislators representing their assembly and senate districts are doing, with views among partisans deeply divided. About four in ten or more across demographic groups and regions approve.
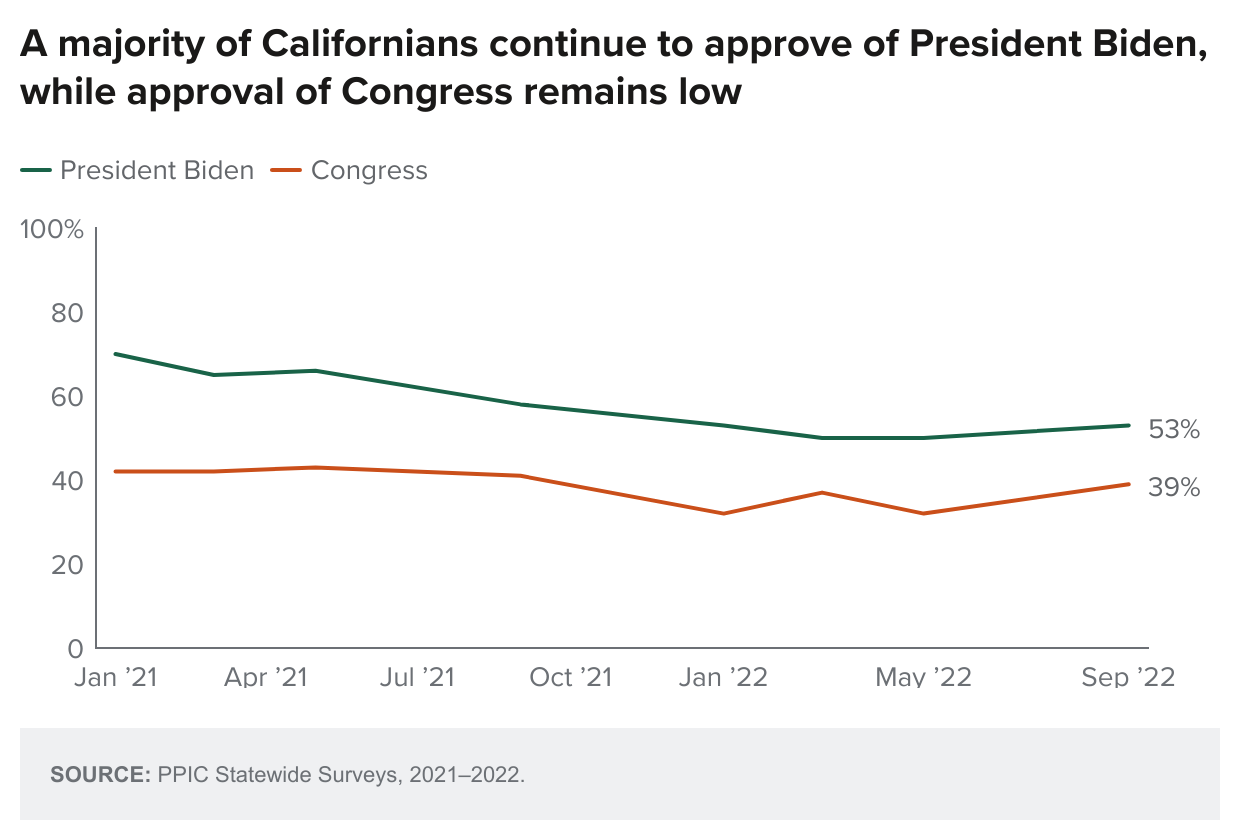
Majorities of adults and likely voters (53% each) approve of the way President Biden is handling his job; 42 percent of adults and 46 percent likely voters disapprove. Approval is now similar to September 2021 (58% adults, 55% likely voters). Today, most Democrats approve, while most Republicans disapprove; independents are divided. About half or more across most demographic groups approve, with the exception of whites and adults with incomes of $40,000 to $79,999. Majorities of residents in the San Francisco Bay Area and Los Angeles approve, compared to fewer in other regions. Approval of President Biden is higher in California than at the national level: according to a Gallup poll conducted in August, 44 percent approve and 53 percent disapprove.
Thirty-nine percent of adults and 34 percent of likely voters approve of the US Congress; approval was similar a year ago (41% adults, 31% likely voters). Nationally, just 22 percent of adults approve of Congress and 76 percent disapprove, according to an August 2022 Gallup poll.
A majority of adults (54%) and likely voters (56%) approve of the way their US House representative is handling his or her job, with partisans deeply divided. Approval was nearly identical in September 2020 (55% adults, 56% likely voters). Today, about half or more across demographic groups approve, with the exception of 44 percent of adults with incomes of $40,000 to $79,999. About half or more across regions approve, with the exception of 42 percent in the Central Valley.
Topics
COVID-19 Criminal Justice Economy Health & Safety Net Housing Political Landscape Statewide SurveyLearn More
Abortion Rights Are Number One for Californians this November
California Voter and Party Profiles
California’s Likely Voters
Californians Show Renewed Faith in the Electoral Process
Most Californians Continue to Identify Homelessness as a Big Problem

Solid Majorities of Californians View Crime as a Problem