Long-term increases in independent registration have reshaped the electorate.
- Among registered voters, 46.8% are Democrats, 23.9% are Republican, and 22.7% say they are independent (also known as “decline to state” or “no party preference”).
- Twenty years ago, during the lead up to the 2002 gubernatorial election, Republicans (35.0%) made up a much higher share of the electorate than today, while independents (14.8%) made up a much lower share. The Democratic share (45.0%) in 2002 was slightly lower.
- Since 2018, the year leading up to the last gubernatorial election, the share of Democrats has increased (44.4% in 2018), while the share of Republicans has declined (25.1% in 2018). The share of independents has also declined since 2018 (25.5%).
Most independent likely voters lean toward a major party.
- In surveys over the past year, independent likely voters have been more likely to lean Democratic (52%) than Republican (37%); 11% did not lean toward either party.
- These shares have shifted since 2018, when 43% leaned Democratic, 29% leaned Republican, and 28% did not lean toward either party.
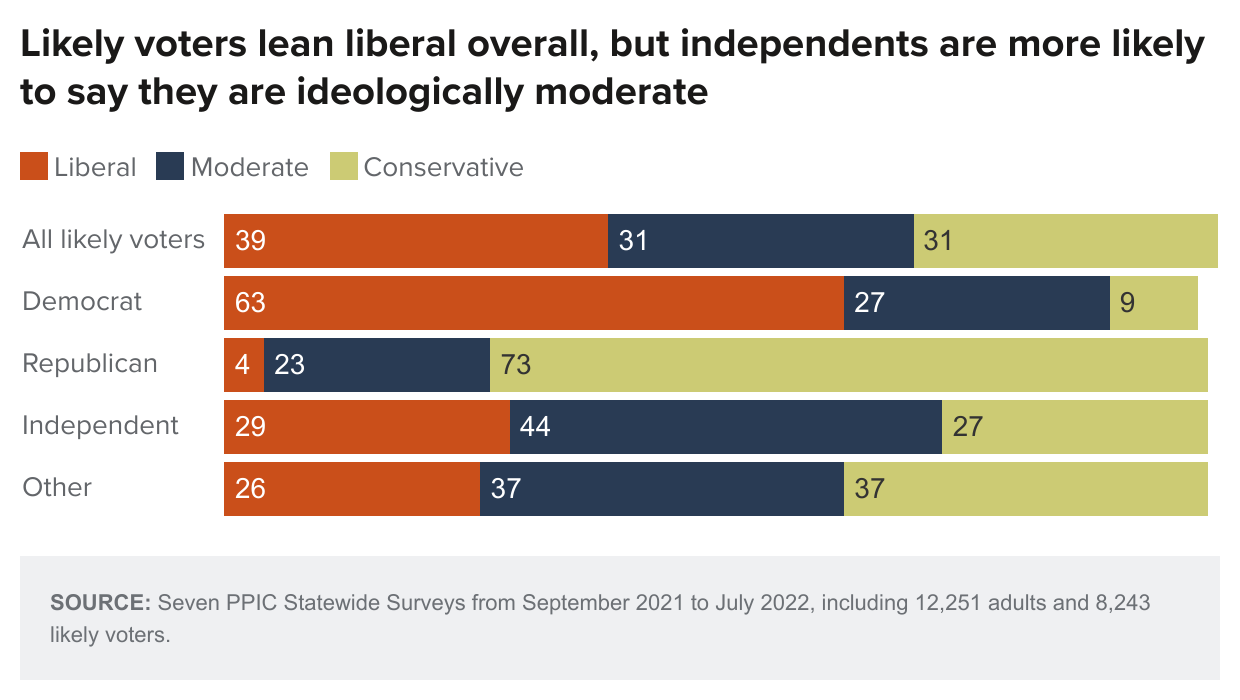
- Independent likely voters are much more likely to be moderate (44%) than liberal (29%) or conservative (27%).
- Overall, about three in four (73%) Republican likely voters say they are conservative, while 63% of Democratic likely voters describe themselves as liberal. Conversely, only 9% of Democrats label themselves as conservative, while just 4% of Republicans call themselves liberal.
Likely voters are disproportionately white; Democratic likely voters are more diverse.
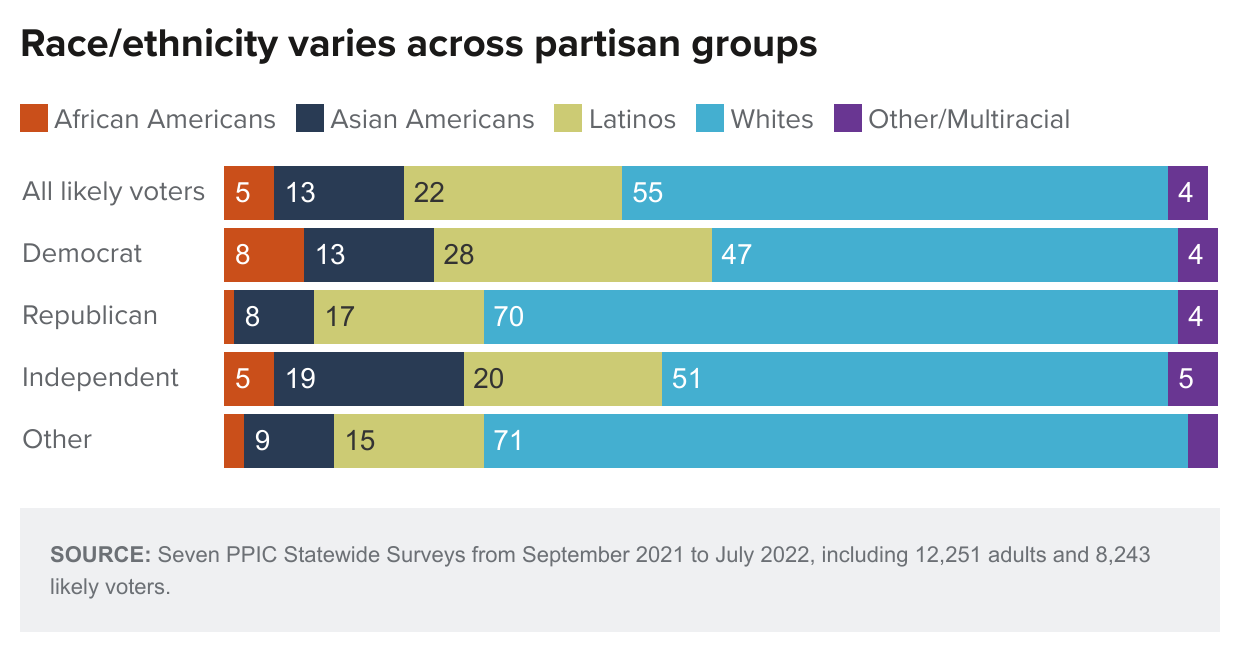
- Whites make up only 40% of California’s adult population but comprise 55% of likely voters. In contrast, Latinos make up 35% of the state’s adult population but only 22% of likely voters. The shares of Asian American (13%) and African American (5%) likely voters are roughly proportionate to their shares of the state’s adult population—16% for Asian Americans and 6% for African Americans.
- Just under half (47%) of Democratic likely voters are white; 28% are Latino, 13% are Asian American, and 8% are African American.
- An overwhelming majority (70%) of Republican likely voters are white; relatively few are Latino (17%), Asian American (8%), or African American (1%).
- Among independents, 51% are white, 20% are Latino, 19% are Asian American, and 5% are African American.
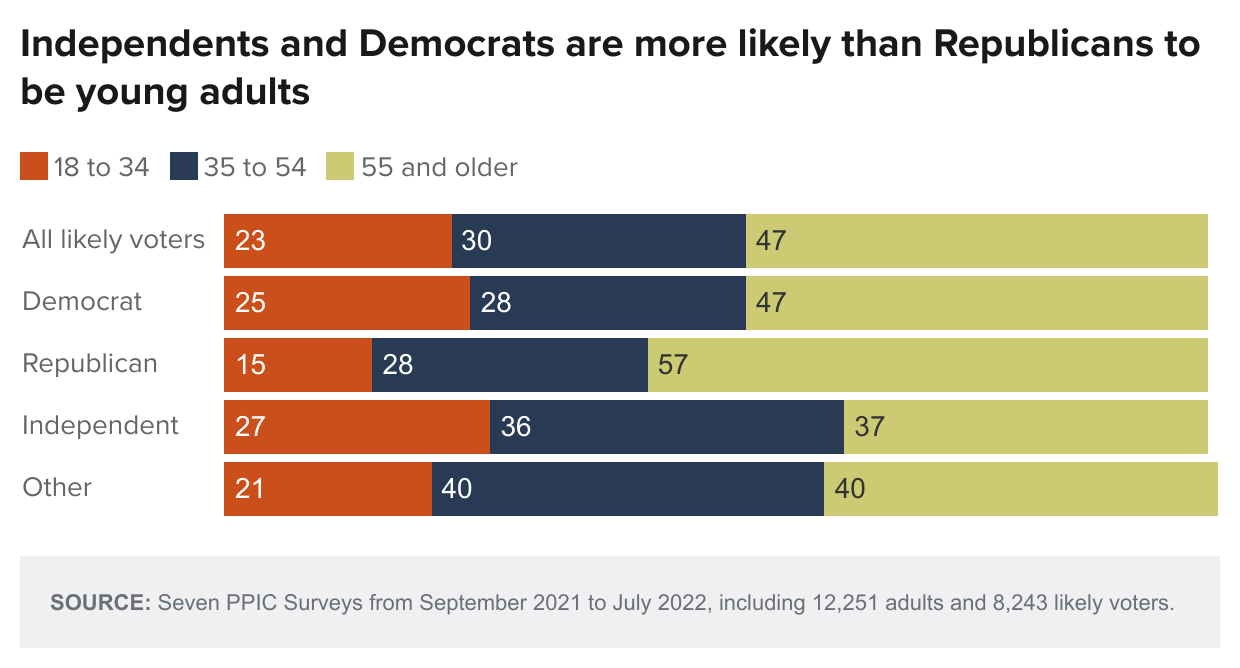
Many demographic traits of likely voters differ across parties.
- Independents (27%) and Democrats (25%) are more likely to be young adults (age 18 to 34) than are Republicans (15%), while Republicans are more likely to be age 55 and older (57%) than are Democrats (47%) or independents (37%).
- Democratic likely voters are much more likely to be women (59%) than men (41%), while independents are much more likely to be men (59%) than women (41%); Republicans (51% men, 49% women) are more evenly divided.
- Independents (46%) and Democrats (44%) are much more likely to be college graduates than are Republicans (29%).
- About one in four Democrats (24%) have household incomes under $40,000, compared to about two in ten Republicans (19%) and independents (19%).