
Table of Contents
- Key Takeaways
- Introduction
- Improvements in Internet Access Were Modest
- Gains in Device Access Were Substantial
- Who Can Fully Participate in Distance Learning?
- Despite Vast Improvement, Serious Gaps Remain
- Closing the Remaining Gaps
- Recommendations
- Notes and References
- Authors and Acknowledgments
- PPIC Board of Directors
- Copyright
Key Takeaways
As the COVID-19 pandemic has shown, digital connectivity is critical to student learning. Gaps in digital access—including reliable access to internet and a digital device—are a driving force in the educational inequities evident during distance learning. In this report, we use data on a sample of California households with children enrolled in school to examine changes in digital access and equity from spring 2020 to spring 2021.
- Device access rose dramatically early in the pandemic. Statewide, 82 percent of households had reliable device access in fall 2020, up from 68 percent in spring 2020. Gains were greatest for low-income households, households without a bachelor’s degree, and Black and Latino households.→
- Improvements in internet access were more modest. The share of households with reliable internet access rose from 71 percent to 75 percent between spring and fall 2020. Gains were strongest among low-income households and households without a bachelor’s degree.→
- Progress stalled in spring 2021, and major equity gaps remain. Forty-one percent of low-income households still do not have full digital access to both the internet and a device for educational purposes; neither do 37 percent of Latino households and 29 percent of Black households.→
- Local innovations offer models for long-term solutions. Efforts to address the digital divide prior to the pandemic show how diverse districts can ensure students have internet access at home.→
- Better data is needed to identify existing gaps in broadband access and allocate investments. Partnerships between public agencies and private companies will be key to producing more granular maps that detail which students lack high-speed internet access.→
- Affordability is a major concern. Given the low levels of digital access among low-income households, the state should assess the continued need after the current federal emergency program expires.→
Introduction
The COVID-19 pandemic has underscored the importance of digital connectivity in education, while revealing serious inequities in access to broadband and computing devices. When schools shut down for in-person instruction, distance learning became the default mode of schooling, and district officials and governments at all levels responded with efforts to put computing devices in students’ hands and provide them with reliable internet connections. In California as a whole, these efforts achieved some success—overall rates of device access and connectivity increased between the spring semester of 2020, at the beginning of the pandemic, and the subsequent fall semester. But progress in spring 2021 was not as clear cut, and the gains were not uniform across racial/ethnic groups, income and education levels, or regions of the state. More importantly, current levels of readiness for distance learning still indicate deep inequalities.
The picture just prior to the onset of the pandemic was already unequal. In 2019, only 67 percent of California’s K–12 students had reliable access to computing devices at home; access rates were even lower among low-income (52%), Black (58%), and Latino (61%) students. Even with a device, digital access is a challenge without consistent internet connectivity at home, which only 71 percent of the state’s K–12 students had in spring 2020 (Gao and Hayes 2021).
The pandemic spurred unprecedented federal and state investments to increase digital access. Major federal initiatives like the Emergency Broadband Benefit program and the Emergency Connectivity Fund focused on broadband affordability, while programs like the Treasury Department’s Coronavirus Capital Projects Fund aimed to expand infrastructure. Congress is considering a bipartisan infrastructure package that would allocate $65 billion to expand broadband infrastructure. Since 2020, the state government has established partnerships with internet service providers and technology companies to deliver devices to students and establish Wi-fi hotspots in areas in need. The 2021–22 state budget also allocated $6 billion to build middle- and last-mile connections across California. Locally, many districts have purchased new devices for students to keep and use at home during distance learning.
How did digital access and equity change after the first year of these unprecedented investments? To answer this question, we use data from the US Census Bureau’s Household Pulse Survey, which asked about access to the internet and computing devices for educational purposes. The sample is representative for California. From spring 2020 to spring 2021, the sample included 35,847 unique California households with children enrolled in school. Scaled up to the state’s full population, this would account for some 2.5 million households. We chart progress over time among various groups of students—including by race/ethnicity, socioeconomic status, and geography—and compare their rates of access at the end of the 2020–21 school year to examine current equity gaps. Next, we turn our attention to the federal, state, and local efforts underway to improve digital access for students, and we examine several local initiatives aimed at providing home internet access to students. Finally, we conclude with recommendations to ensure that investments in broadband are allocated effectively, efficiently, and equitably.
Improvements in Internet Access Were Modest
Overall, California households with schoolchildren saw a statistically significant increase in reliable internet access between spring and fall of 2020, from 71.0 percent to 74.8 percent. There were no meaningful changes in spring 2021. The stall from fall 2020 to spring 2021 could be due to various reasons. First, although many internet service providers offered free or subsidized internet access, these programs are temporary and may have expired over the course of the pandemic (FCC 2020). In addition, the Emergency Broadband Benefit, which was included in the December stimulus to provide much-needed support for low-income households, did not start until mid-May 2021, so households may have experienced gaps in the available subsidies. Second, temporary fixes—such as Wi-fi hotspots that some districts distributed—do not work in areas without broadband infrastructure, and in some cases, are insufficient to provide stable video and audio, making participation difficult. As a result, internet access remains limited in rural and remote areas as well as in some densely populated urban areas. Third, households with children enrolled in school have an average of four people, and multiple users need additional bandwidth for reliable access (Gao and Hayes 2021). Upgrading household internet subscriptions to support multiple users may have been more challenging after some subsidy programs ended. Last, some districts reopened for in-person instruction in spring 2021, reducing the immediate demand for reliable home access to the internet.
Reliable internet access for households with children enrolled in school increased after spring 2020
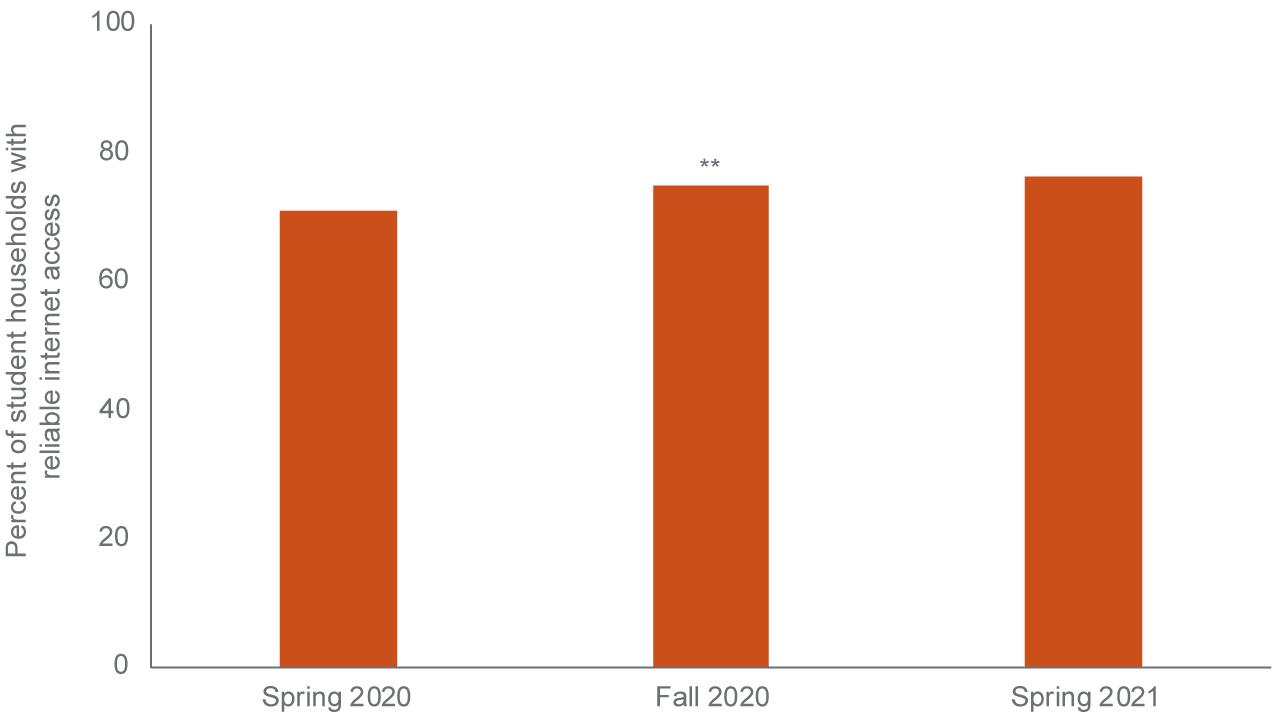
SOURCE: Authors’ calculations using Census Bureau Household Pulse Survey data, 2020–2021.
NOTE: ** denotes a statistically significant difference from spring 2020 rates at the 5 percent level.
There is some encouraging news when we examine progress by socioeconomic indicators. Between spring and fall of 2020, rates of reliable internet access rose significantly among households headed by someone with less than a bachelor’s degree (from 66.8% to 71.5%), and among low-income households making less than $50,000 per year (57.2% to 65.8%). There is some indication that rates may have risen considerably among Black households (61.3% to 74.9%) during that time as well— although this increase is not statistically significant, likely due to small sample sizes.
Internet access improved among households with less formal education and low-income households
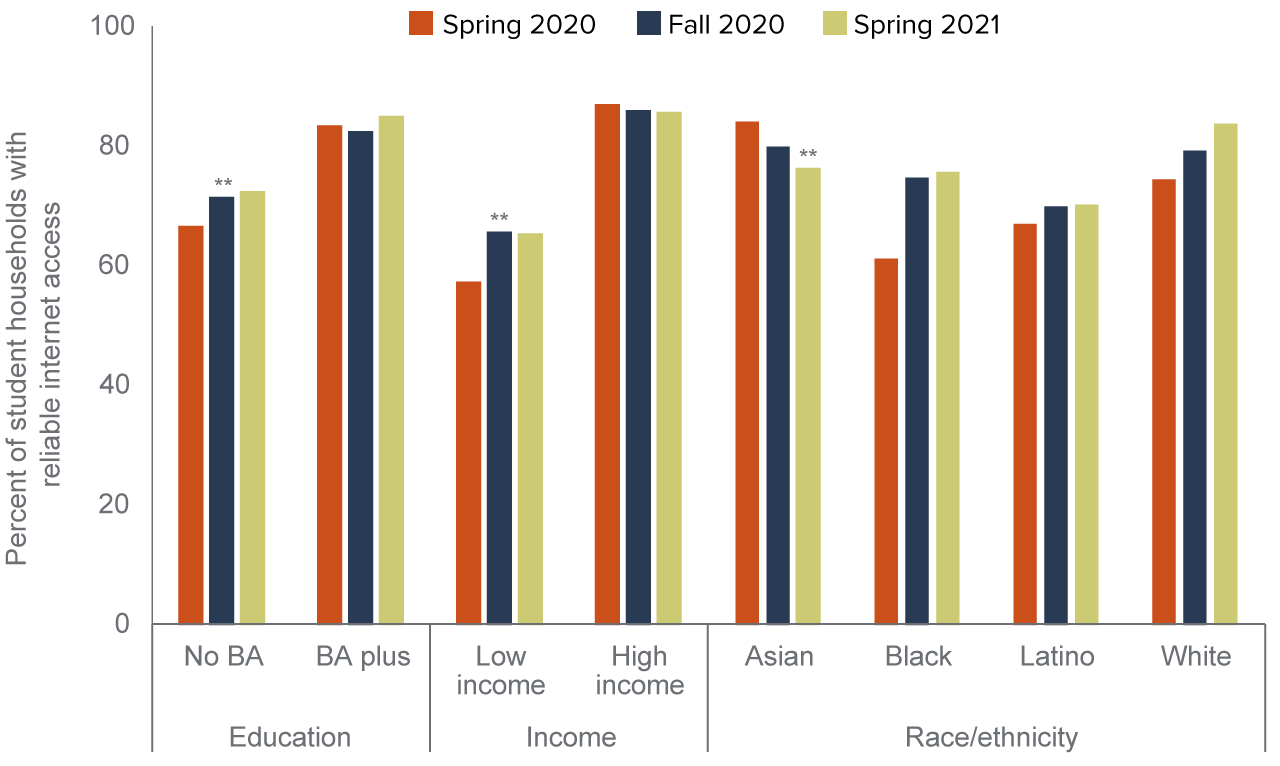
SOURCE: Authors’ calculations using Census Bureau Household Pulse Survey data, 2020–2021.
NOTES: ** denotes a statistically significant difference from spring 2020 rates at the 5 percent level. Low income: household income (2019) < $50,000, which is roughly the cutoff for 200 percent of the federal poverty line in California ($51,500). High income: household income (2019) > $100,000. Race/ethnicity based on the survey respondent.
One somewhat puzzling result is that Asian households report a significant decline in internet access from spring 2020 (84.1%) to spring 2021 (76.3%). One possible explanation is the wording of the question, with its qualifier: “How often is the Internet available to children for educational purposes? [emphasis added]” At the onset of the pandemic, many parents began working from home, and those who were able to may have upgraded their entire household’s internet subscription to accommodate multiple workers and learners. Those who were not receiving school assistance in obtaining internet access may have replied in the negative. It’s not clear why this would be specific to any racial/ethnic group, although we notice a similar trend among high-income respondents. Comparisons with results from other large states (e.g., Texas, New York, Florida, and Illinois) and the nation as a whole do not yield this result (see Technical Appendix B).
A closer examination reveals larger increases in internet access among the lowest-income households. For households with less than $25,000 in annual income (roughly 100% of the federal poverty level for a family of four), internet access rates rose from 49.7 percent to 62.2 percent from spring 2020 to fall 2020 and remained steady thereafter. Households making between $25,000 and $35,000 per year saw an increase from 54.6 percent to 70.0 percent during the same period (Figure 3).
Internet access improved the most among the lowest-income households
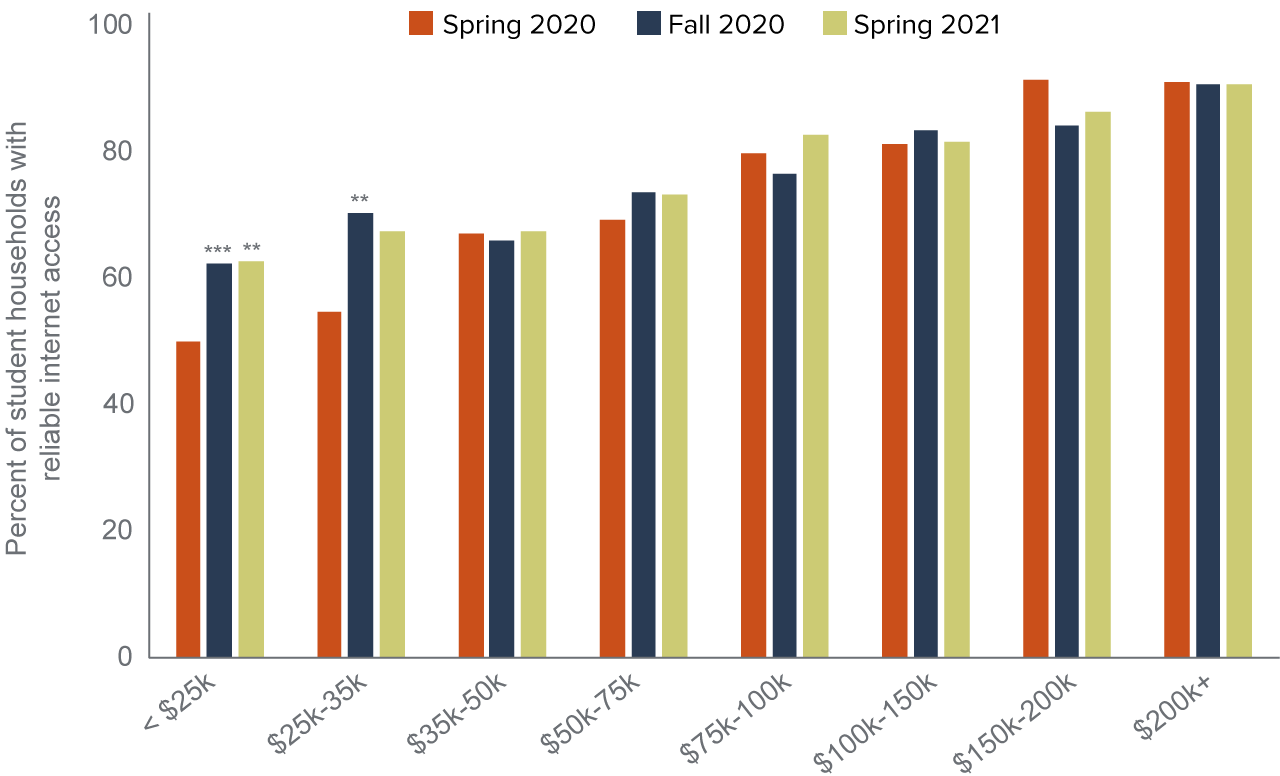
SOURCE: Authors’ calculations using Census Bureau Household Pulse Survey data, 2020–2021.
NOTES: *** denotes a statistically significant difference from spring 2020 rates at the 1 percent level; ** denotes significance at the 5 percent level. Numbers shown are annual household income (2019).
The Household Pulse Survey identifies three metropolitan statistical areas (MSAs) within California: Los Angeles, the San Francisco Bay Area, and Riverside/San Bernardino/Ontario. Of these, households in Los Angeles saw a significant increase in internet access from spring to fall of 2020, from 72.2 percent to 74.1 percent. The other regions also show evidence of an increase during that period, although this was not statistically significant. None of the spring 2021 rates emerged as statistically different from spring 2020.
Major metro areas, particularly Los Angeles, appear to have increased internet access from spring to fall 2020
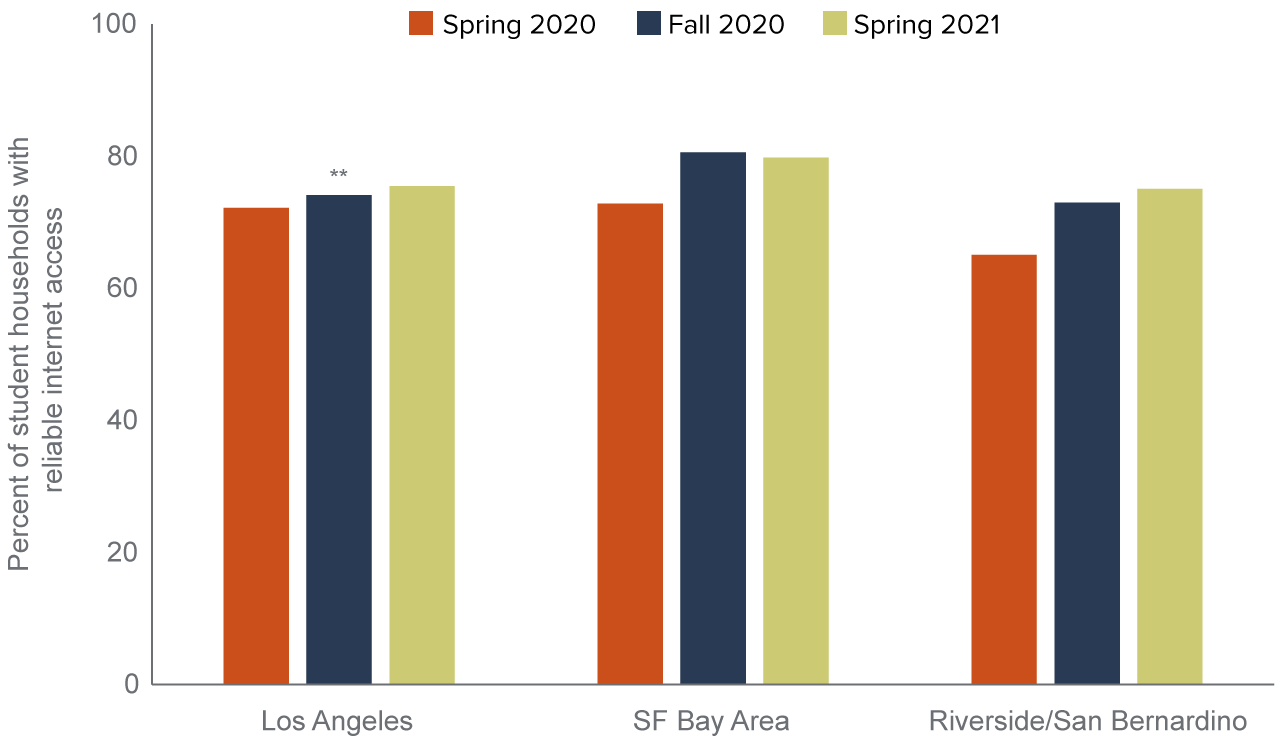
SOURCE: Authors’ calculations using Census Bureau Household Pulse Survey data, 2020–2021.
NOTE: ** denotes a statistically significant difference from spring 2020 rates at the 5 percent level.
Gains in Device Access Were Substantial
Efforts to provide students with a computing device appear to have been more successful than efforts to improve internet access. In spring 2020, 67.5 percent of California households reported reliable device access; this shot up to 81.6 percent and 81.8 percent in fall 2020 and spring 2021, respectively. State and local efforts contributed to this improvement. Since spring 2020, the state has established a number of partnerships with internet service providers and technology companies to deliver devices and Wi-fi hotspots. In addition, 95 percent of districts reported having purchased new devices for students (Gao, Hill, and Lafortune 2021). Many schools shifted from shared devices that were kept in classrooms to devices that students keep at home (Herold 2020).
Device access rose dramatically after spring 2020
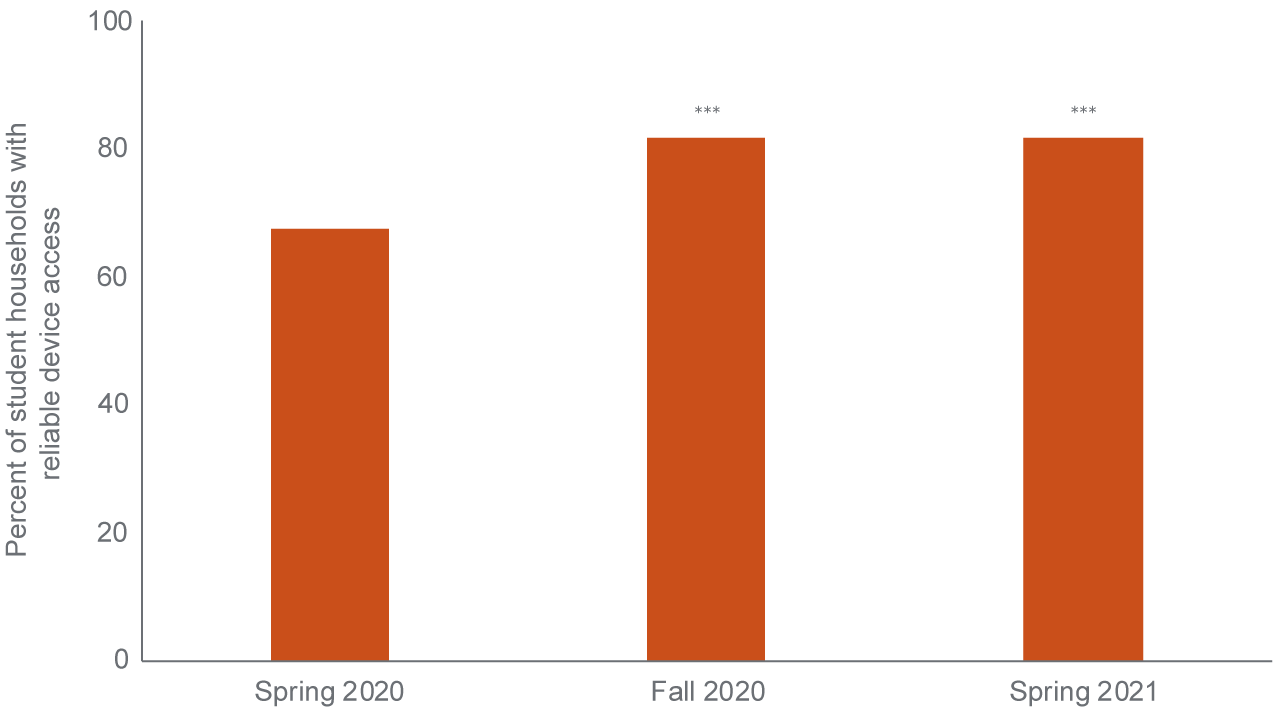
SOURCE: Authors’ calculations using Census Bureau Household Pulse Survey data, 2020–2021.
NOTE: *** denotes a statistically significant difference from spring 2020 rates at the 1 percent level.
This pattern of a sharp increase from spring to fall, and then a mere maintenance of that new level, appears in many of the results, including the breakdowns by socioeconomic, demographic, and regional characteristics. Global laptop shortages and long delays may be further complicating schools’ efforts to distribute devices to students in need (Gecker and Liedtke 2020). While the increases over the spring 2020 levels are statistically significant in most cases, the lack of continued progress means there is more work to be done to ensure universal access to a computing device.
Households headed by someone without a bachelor’s degree saw their device access improve from 62.4 percent to 79.2 percent—a larger increase than among households with at least a bachelor’s degree—but they finished the spring 2021 semester with a lower level of access than their more-educated counterparts (78.8% in spring 2021, compared with 89.2%). Similarly, low-income households’ device access rose from 51.6 percent to 75.4 percent between spring and fall 2020, then leveled off at 73.8 percent. Their high-income counterparts went from 85.4 percent to 89.4 percent during that time—not a statistically significant change.
Black, Latino, and white households all saw significant increases in device access, and in some cases the leaps were quite substantial: from 57.8 percent to 86.0 percent for Black households, and 61.0 percent to 77.7 percent for Latino households. Again, Asian households provided a contrary example, with access rates increasing somewhat, but not significantly so.
Reliable device access increased nearly across the board
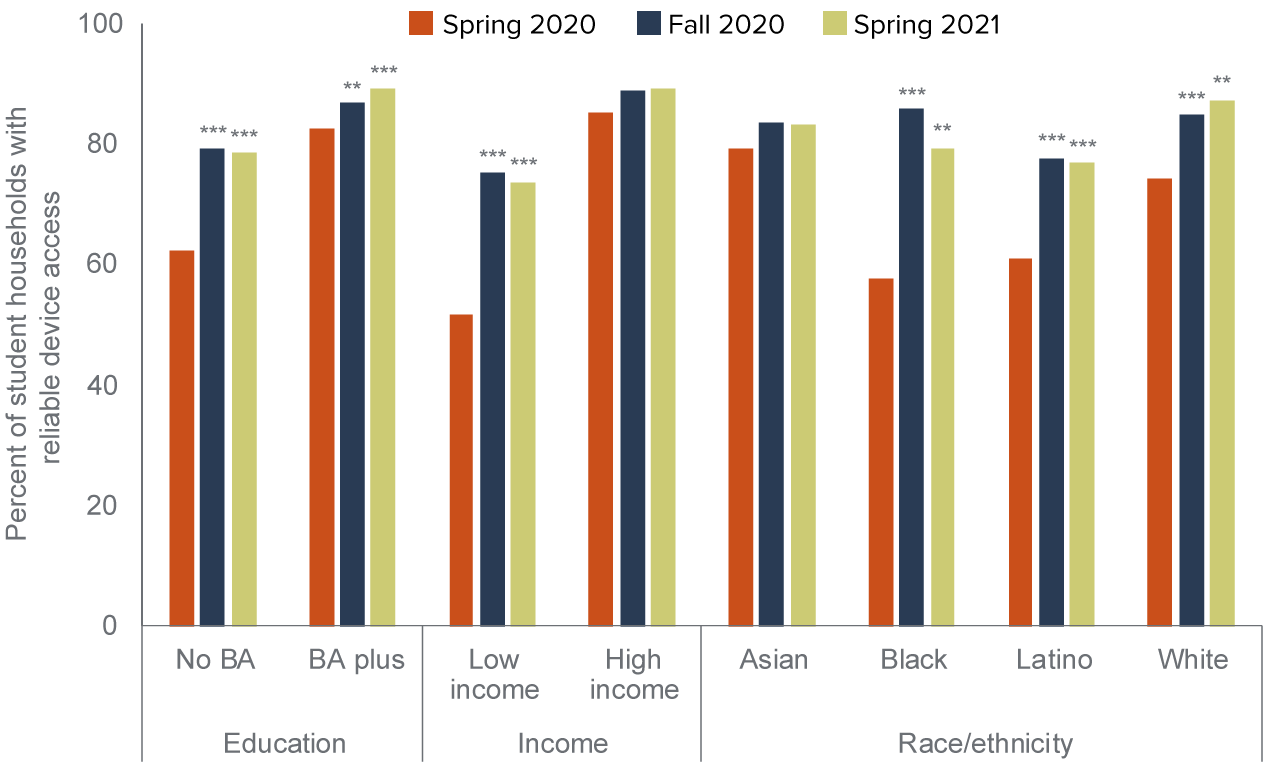
SOURCE: Authors’ calculations using Census Bureau Household Pulse Survey data, 2020–2021.
NOTES: *** denotes a statistically significant difference from spring 2020 rates at the 1 percent level; ** denotes significance at the 5 percent level. Low income: household income (2019) < $50,000, which is roughly the cutoff for 200 percent of the federal poverty line in California ($51,500). High income: household income (2019) > $100,000. Race/ethnicity based on the survey respondent.
As with internet access, device access also rose most dramatically for households with the lowest incomes. Among households making less than $25,000 per year, 44.6 percent had consistent device access in spring 2020, compared with 71.0 percent in fall 2020. The two next-lowest income tiers saw similarly impressive gains of 18 percentage points or more: from 53.4 percent to 80.9 percent, and from 56.7 percent to 75.0 percent, respectively.
Low-income households saw the largest increases in device access
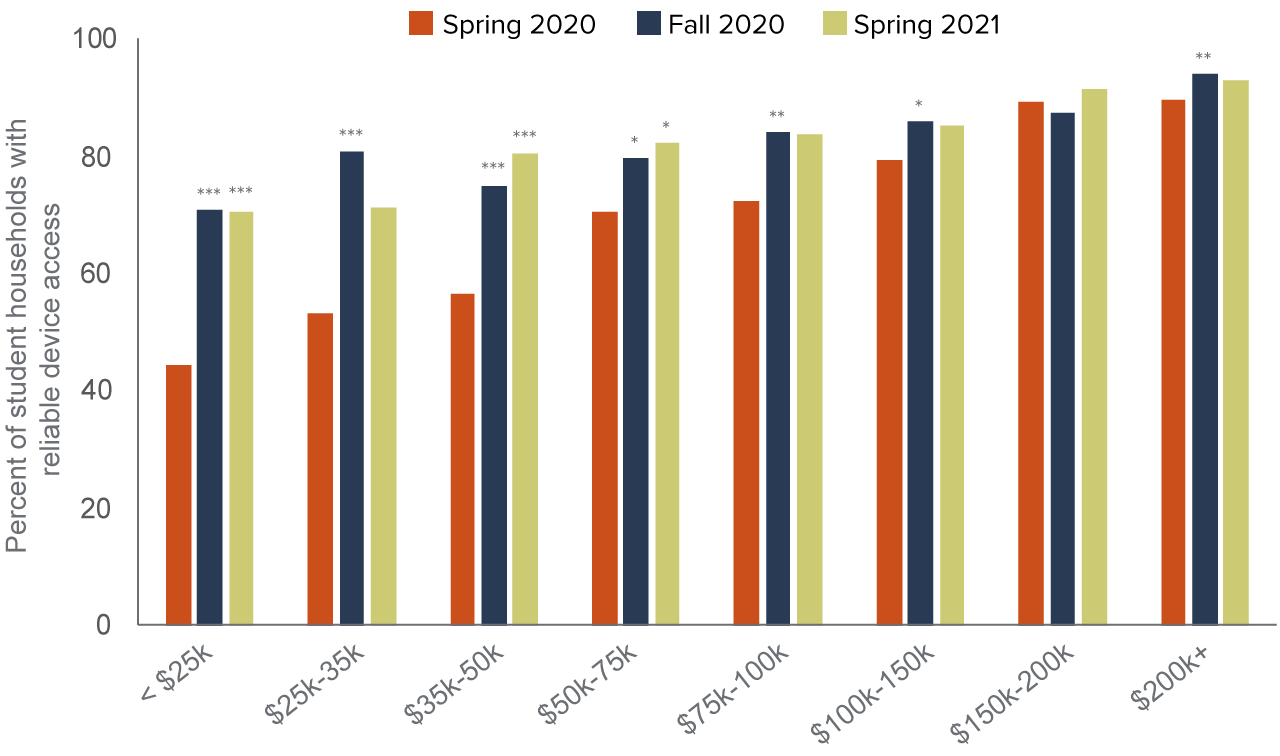
SOURCE: Authors’ calculations using Census Bureau Household Pulse Survey data, 2020–2021.
NOTES: *** denotes a statistically significant difference from spring 2020 rates at the 1 percent level; ** denotes significance at the 5 percent level; * denotes significance at the 10 percent level. Numbers shown are annual household income (2019).
Each region also saw significant increases in device access after the pandemic began. Rates for Los Angeles households increased from 68.0 percent to 80.4 percent, and rates in the Riverside/San Bernardino metro rose from 61.9 percent to 80.1 percent between spring 2020 and fall 2020. Households in the San Francisco Bay Area began with a relatively high rate of 73.6 percent, and still saw significant gains in each of the subsequent semesters, ending spring 2021 at 85.9 percent.
Device access improved in the LA, Bay Area, and Riverside/San Bernardino metro areas
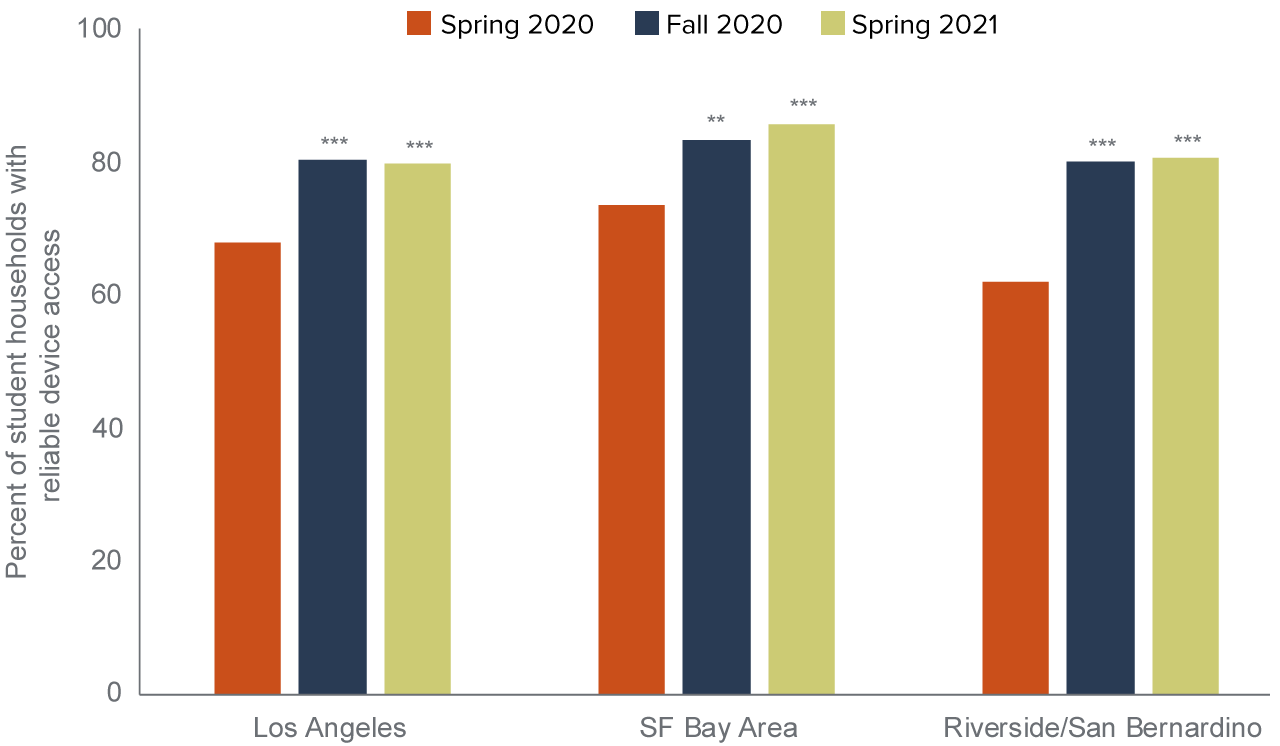
SOURCE: Authors’ calculations using Census Bureau Household Pulse Survey data, 2020–2021.
NOTE: *** denotes a statistically significant difference from spring 2020 rates at the 1 percent level; ** denotes significance at the 5 percent level.
Who Can Fully Participate in Distance Learning?
To take full advantage of the distance learning format, students need both a reliable high-speed internet connection and constant access to a compatible device. By this measure, California made significant improvements. In spring 2020, 60.1 percent of households with children enrolled in school had access to both reliable internet and a device; this went up to 69.4 percent in fall 2020, followed by an incremental increase to 70.7 percent by spring 2021. While the progress is certainly good news, three in ten households still lacked access to either reliable internet or a device in spring 2021.
Full digital access increased after spring 2020
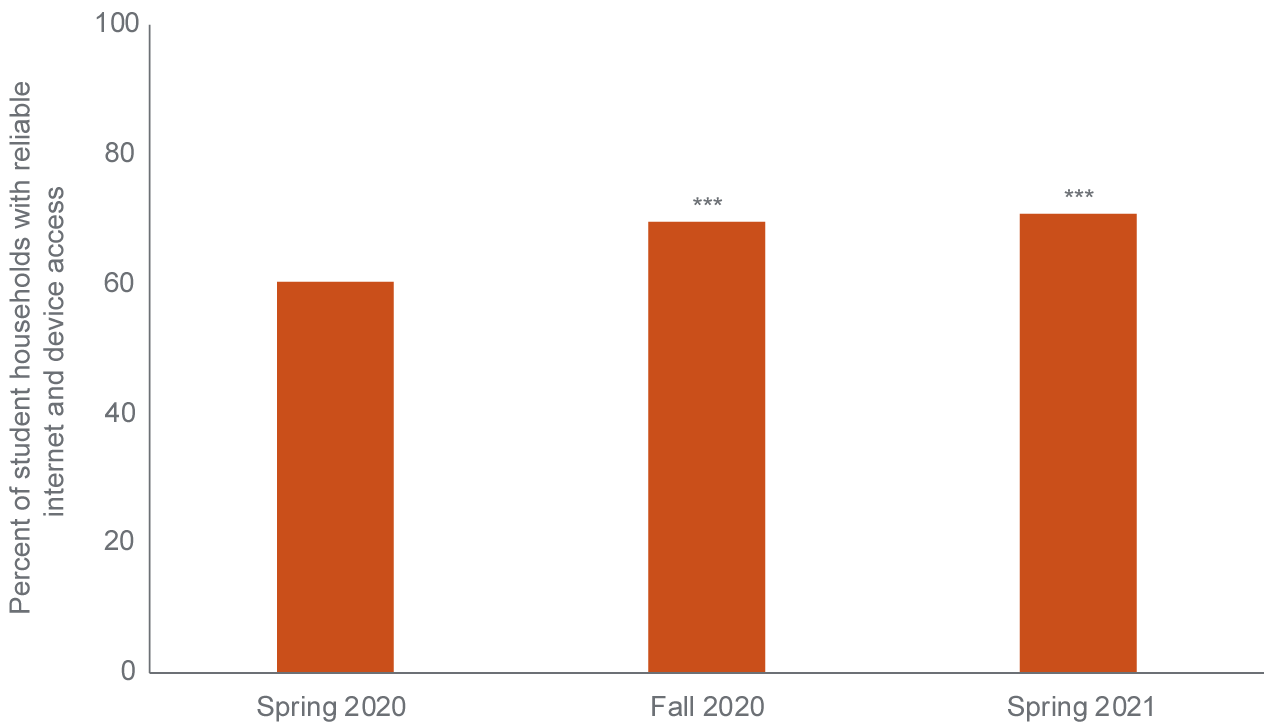
SOURCE: Authors’ calculations using Census Bureau Household Pulse Survey data, 2020–2021.
NOTE: *** denotes a statistically significant difference from spring 2020 rates at the 1 percent level.
Encouragingly, the gains were most apparent among groups with the lowest levels of access at the outset. Among households headed by someone without a bachelor’s degree, 54.4 percent had access to both reliable internet and a device in spring 2020; this jumped to 65.5 percent in fall 2020, and then to 66.2 percent in spring 2021. Among low-income households, full digital access rose from 44.4 percent in spring 2020 to 60.2 percent that fall. (This number then dipped to 58.6% by spring 2021, but that still represents a significant improvement over the spring 2020 figure.)
Full digital access among Black households jumped to 71.5 percent in fall 2020 (51.3% in spring 2020), while Latino households saw an increase to 63.9 percent by fall 2020 (52.4% in spring 2020). Changes for Asian and white households were not statistically significant.
Full digital access rose the most among low-access groups
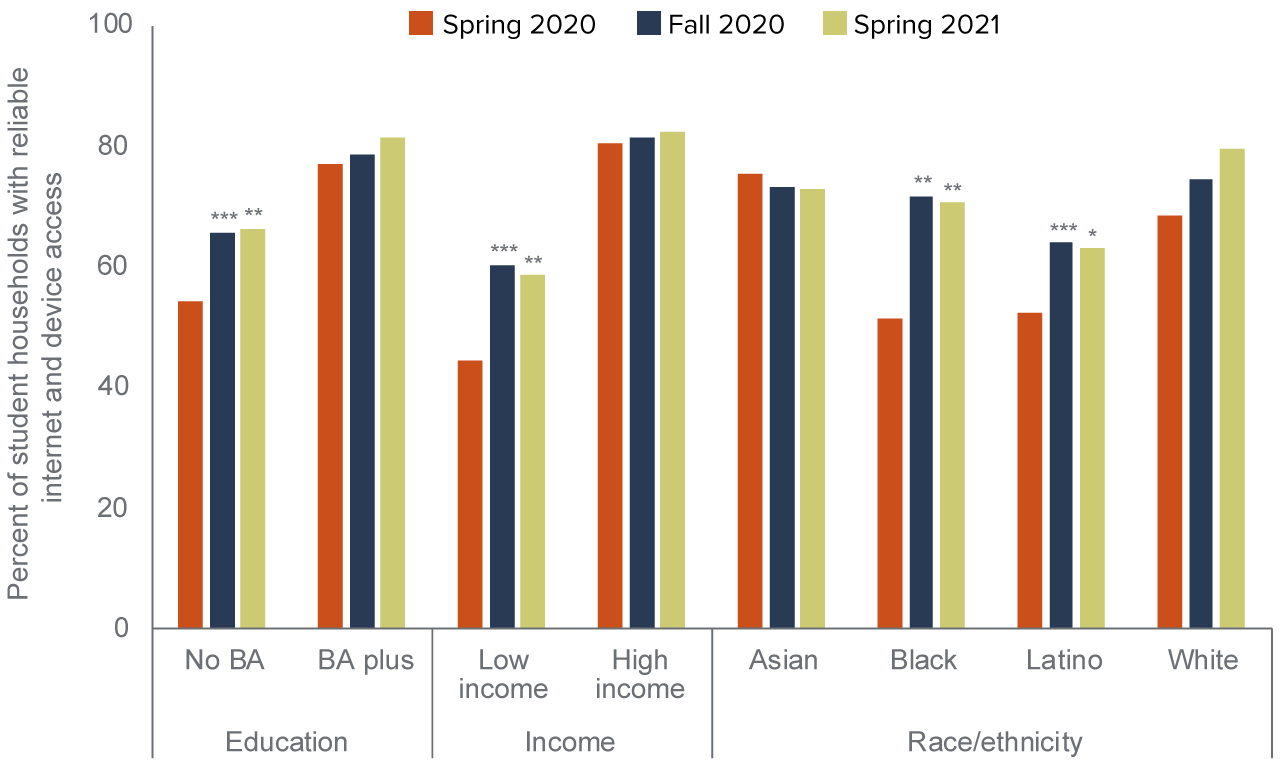
SOURCE: Authors’ calculations using Census Bureau Household Pulse Survey data, 2020–2021.
NOTE: *** denotes a statistically significant difference from spring 2020 rates at the 1 percent level; ** denotes significance at the 5 percent level; * denotes significance at the 10 percent level. Low income: household income (2019) < $50,000, which is roughly the cutoff for 200 percent of the federal poverty line in California ($51,500). High income: household income (2019) > $100,000. Race/ethnicity based on the survey respondent.
Again, we see that the most striking advances in access to both the internet and a device took place among households with the lowest annual incomes. For households with annual incomes under $25,000, 35.2 percent had full access in spring 2020, which shot up to 56.4 percent in the fall. For households with incomes between $25,000 and $35,000, the full access rate went from 44.8 percent to 64.4 percent.
Low-income households saw the greatest improvements in full digital access
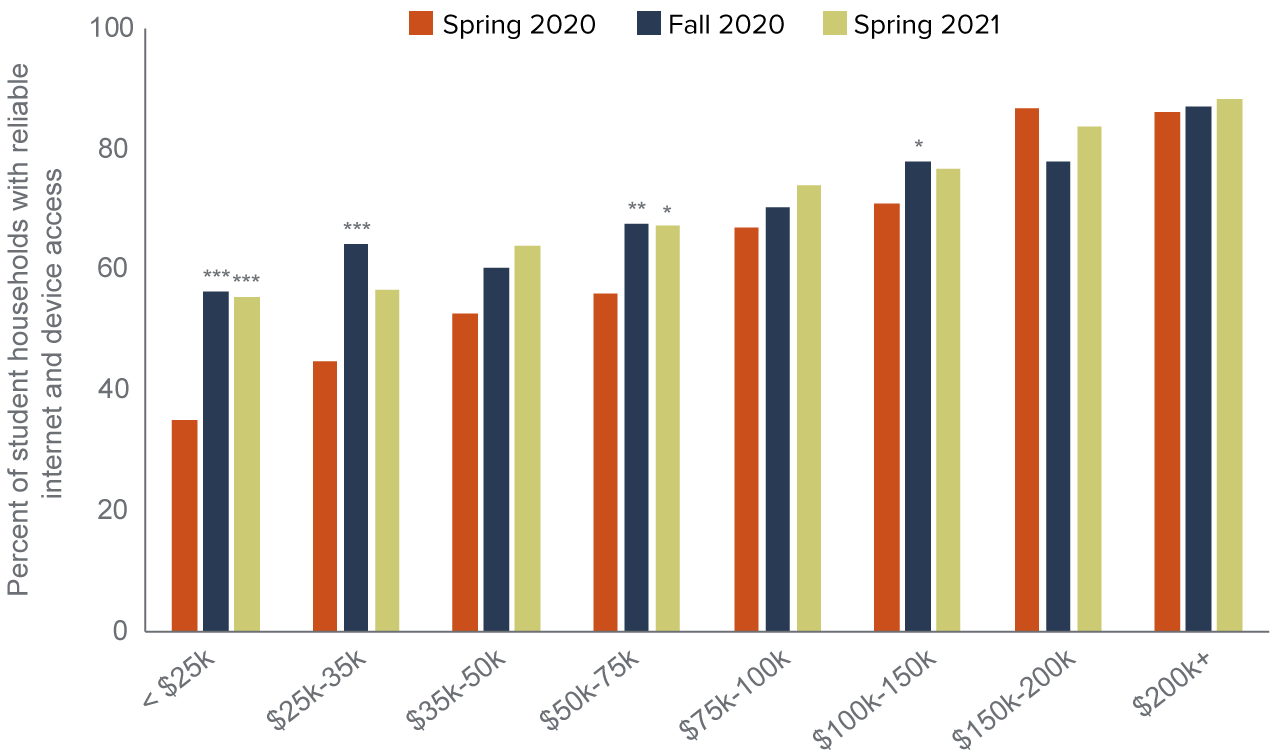
SOURCE: Authors’ calculations using Census Bureau Household Pulse Survey data, 2020–2021.
NOTES: *** denotes a statistically significant difference from spring 2020 rates at the 1 percent level; ** denotes significance at the 5 percent level; * denotes significance at the 10 percent level. Numbers shown are annual household income (2019).
Despite Vast Improvement, Serious Gaps Remain
What is the current state of digital equity gaps after this first year of pandemic-inspired efforts to broaden access? Looking at a snapshot of spring 2021, we find that low-income households are 20.2 percentage points less likely than high-income households to have reliable internet access. In addition, households headed by someone without a bachelor’s degree are 12.4 percentage points less likely to have consistent internet access than households with more formal education.
When it comes to racial/ethnic gaps, Latino households are 13.6 percentage points less likely to report having internet access than white households, while Asian households are 7.6 percentage points less likely than white households to say this. By contrast, the gap between Black and white households (8.1 percentage points) is not statistically significant, indicating that the difference is not statistically significant from zero (Figure 12).
Income and education gaps in reliable internet access narrowed after spring 2020
SOURCE: Authors’ calculations using Census Bureau Household Pulse Survey data, 2020–2021.
NOTES: All gaps except for the Black-white gap are significant at the 1 percent level. Low income: household income (2019) < $50,000, which is roughly the cutoff for 200 percent of the federal poverty line in California ($51,500). High income: household income (2019) > $100,000. Race/ethnicity based on the survey respondent.
Education and income gaps in internet access have both decreased notably, as households without a bachelor’s degree and households with lower incomes reported more significant increases in access than their counterparts (Figure 2). Notably, the gap between low-income and high-income households has declined by about a third. Examining racial/ethnic groups, the Latino-white gap has increased in magnitude. While both Latino and white households saw gains in internet access, white households saw larger gains than Latino households, leading to a widening gap. The still somewhat puzzling trajectory of the Asian-white gap is also consistent with the pattern shown in Figure 2, wherein Asian households reported a decrease in home internet access for educational purposes over the period in question, while access for each of the other racial/ethnic groups increased or remained the same.
We see similar results when examining device access. Households without a bachelor’s degree and low-income households have lower levels of reliable device access than their counterparts, by margins of 10.5 and 15.6 percentage points, respectively. Latino, Black, and Asian households all have lower levels of device access than white households, with gaps of 10.2, 7.9, and 3.9 percentage points, respectively (Figure 13).
Equity gaps in device access decreased across the board
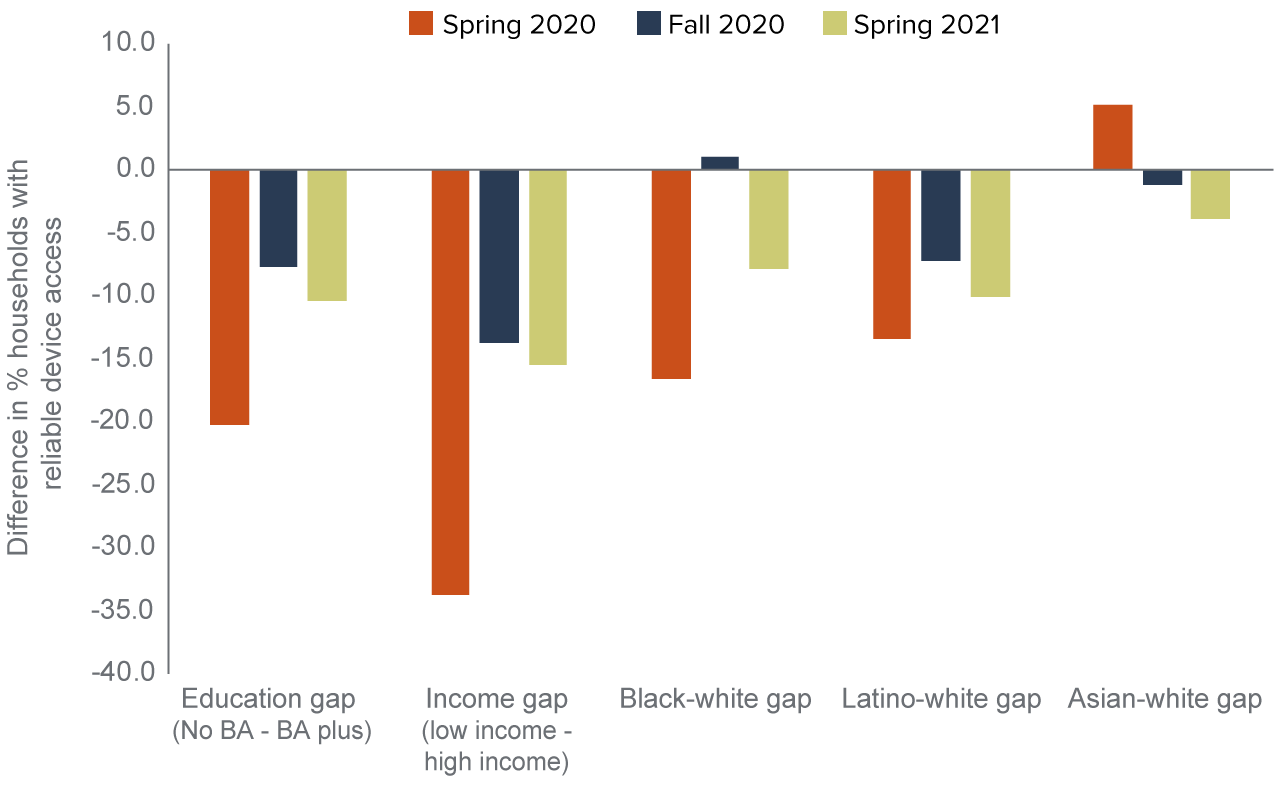
SOURCE: Authors’ calculations using Census Bureau Household Pulse Survey data, 2020–2021.
NOTES: All gaps are significant at the 10 percent level or lower. Low income: household income (2019) < $50,000, which is roughly the cutoff for 200 percent of the federal poverty line in California ($51,500). High income: household income (2019) > $100,000. Race/ethnicity based on the survey respondent.
Gaps in device access have decreased—with education and income gaps narrowing by about half—and are generally smaller than gaps in internet access, suggesting that efforts to improve equitable access to computing devices have met with some success. These results are consistent with Figure 6, in which device access improved more significantly among households without a bachelor’s degree and those with lower incomes—and among households of color—than for their more privileged counterparts. The remaining exception is Asian households, whose trajectory mirrors the pattern we saw for internet access.
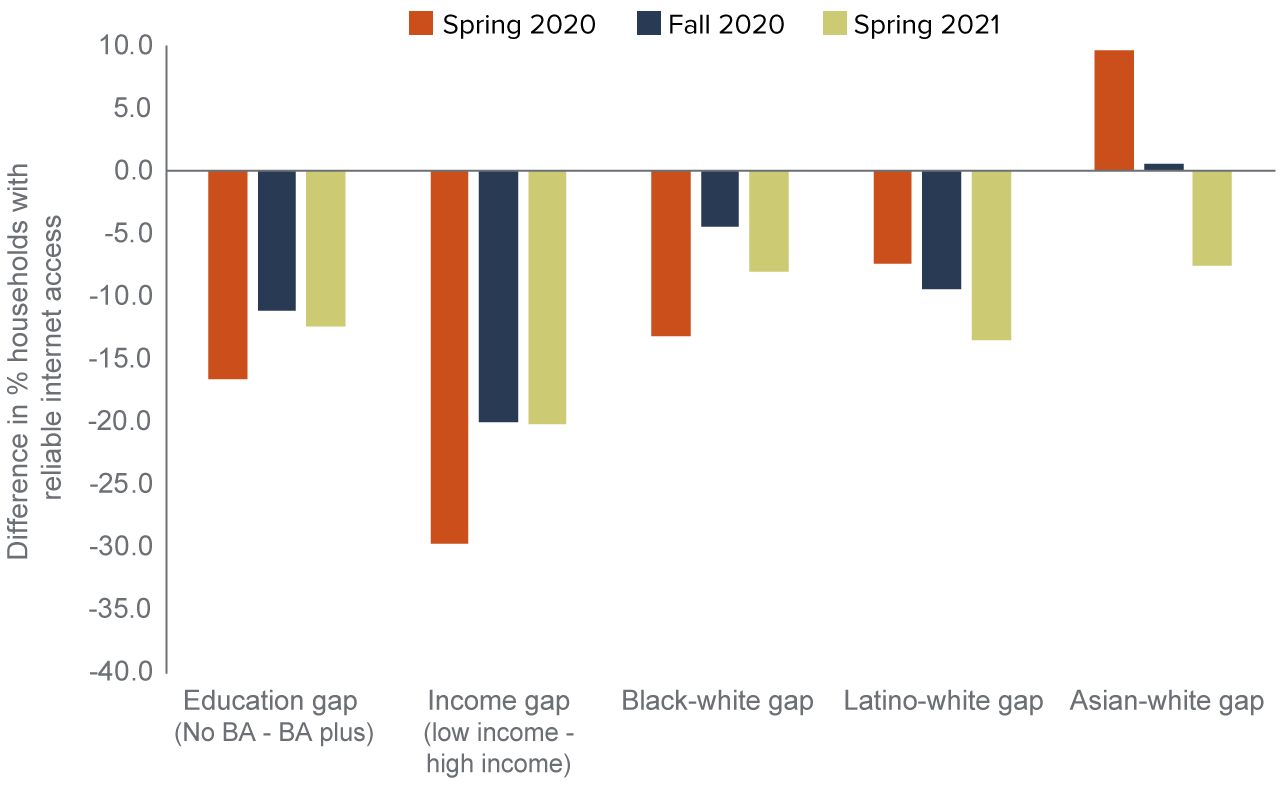
For students relying largely on distance learning, the key metric of concern is reliable access to both an internet connection and a device. The disparities in technological preparedness for distance learning—as measured by the percentages of households with both of these crucial elements—are stark. The difference in reliable internet access between high- and low-income households is 23.9 percentage points, and the difference in reliable access between households with and without a bachelor’s degree is 15.2 percentage points. However, it is noteworthy that, in each case, the equity gap of spring 2020 has been reduced by about a third.
Households of color also endure lower levels of access. Full access is 16.2 percentage points lower for Latino households and 6.4 percentage points lower for Asian households, compared to white households. The difference between white and Black households (8.9 percentage points) was not statistically significant (Figure 14).
Major equity gaps in full digital access persist
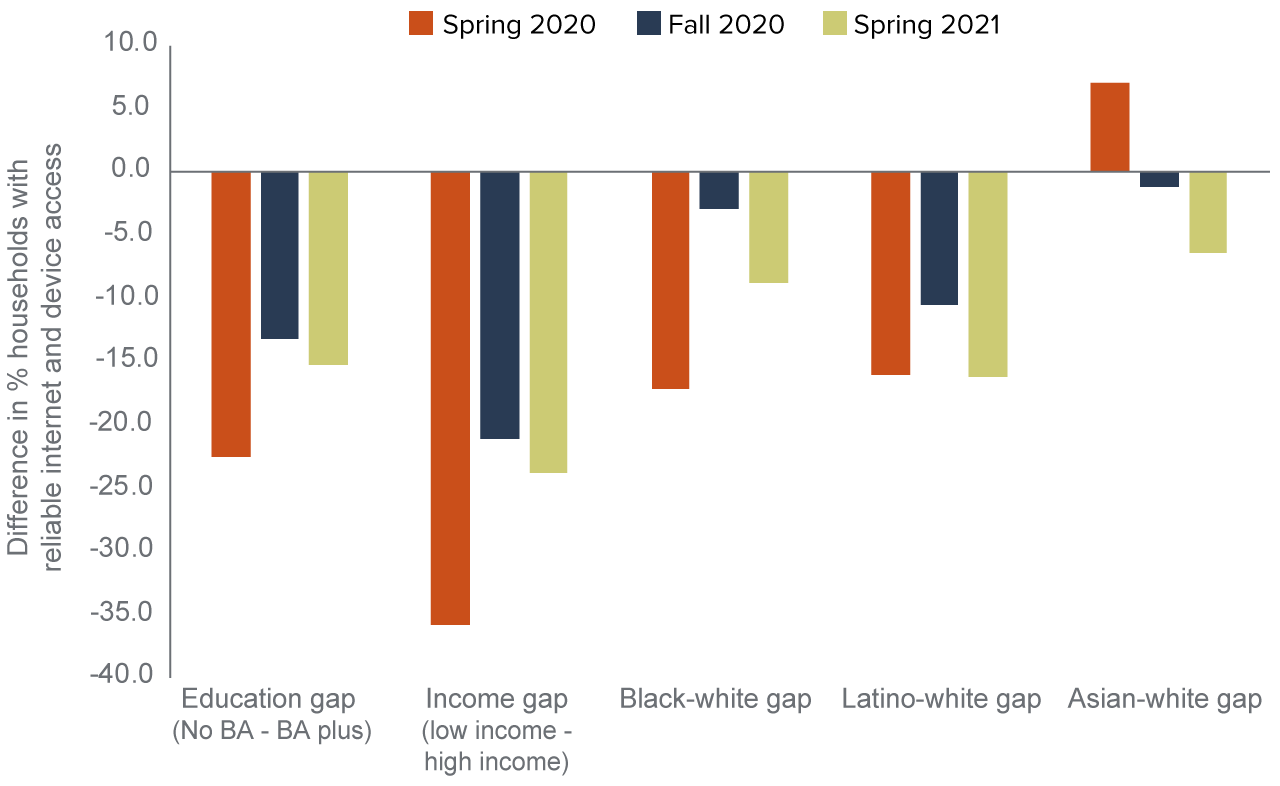
SOURCE: Authors’ calculations using Census Bureau Household Pulse Survey data, 2020-2021
NOTES: All gaps except for the Black-white gap are significant at the 10 percent level or lower. Low income: household income (2019) < $50,000, which is roughly the cutoff for 200 percent of the federal poverty line in California ($51,500). High income: household income (2019) > $100,000. Race/ethnicity based on the survey respondent.
Closing the Remaining Gaps
Affordability and lack of infrastructure are the key barriers to universal broadband access—and our findings suggest that securing reliable internet is a more persistent challenge than access to a reliable computing device. The past year has shown that efforts to remove these barriers can achieve a measure of success, and here we examine some avenues for continuing and expanding on those achievements. Our analyses revealed a strong relationship between income levels and internet access at home. This echoes existing research from the California Emerging Technology Fund and the Pew Research Center, which finds that affordability is the main barrier to home broadband adoption. For households in rural areas, a lack of infrastructure remains a formidable challenge as well (Galperin and Le 2021; Perrin 2021; Gao and Hayes 2021). Policy efforts to close digital equity gaps must address those causes.
Table 1 summarizes major policy initiatives to increase broadband affordability and/or expand broadband infrastructure. For more than two decades, the federal government has attempted to address the digital divide through broadband funding initiatives. For example, the Schools and Libraries Support program (also known as the E-Rate program) provides internet services to schools and libraries. The Lifeline program provides subsidies to low-income families. In 2019, the FCC prioritized rural broadband and announced a new fund to build gigabit-speed broadband services to rural residents. The $20.4 billion Rural Digital Opportunity Fund (RDOF) aims to build broadband infrastructure in rural America over the next 10 years. These programs provide much-needed support to schools and communities, yet many challenges remain. For example, the E-Rate application process has been long criticized as too burdensome, especially for small districts (American Library Association 2008).
At the state level, Governor Newsom signed an executive order in summer 2020 directing state agencies to pursue a minimum download speed of 100 mbps—exceeding the FCC’s broadband definition of 25 mbps/3 mbps—to guide broadband investments. The Broadband Action Plan (2020) identifies critical action items to achieve the goals specified in the governor’s executive order. A study from the California Public Utilities Commission (CPUC) estimates it costs $5.5 billion to connect all Californians to the 25mbps/3mpbs speed and $6.8 billion for the 100mbps/10 mpbs standard (CPUC 2020). The 2021–22 state budget allocates $6 billion to build middle- and last-mile connections across the state.
Major federal and state initiatives to expand broadband access
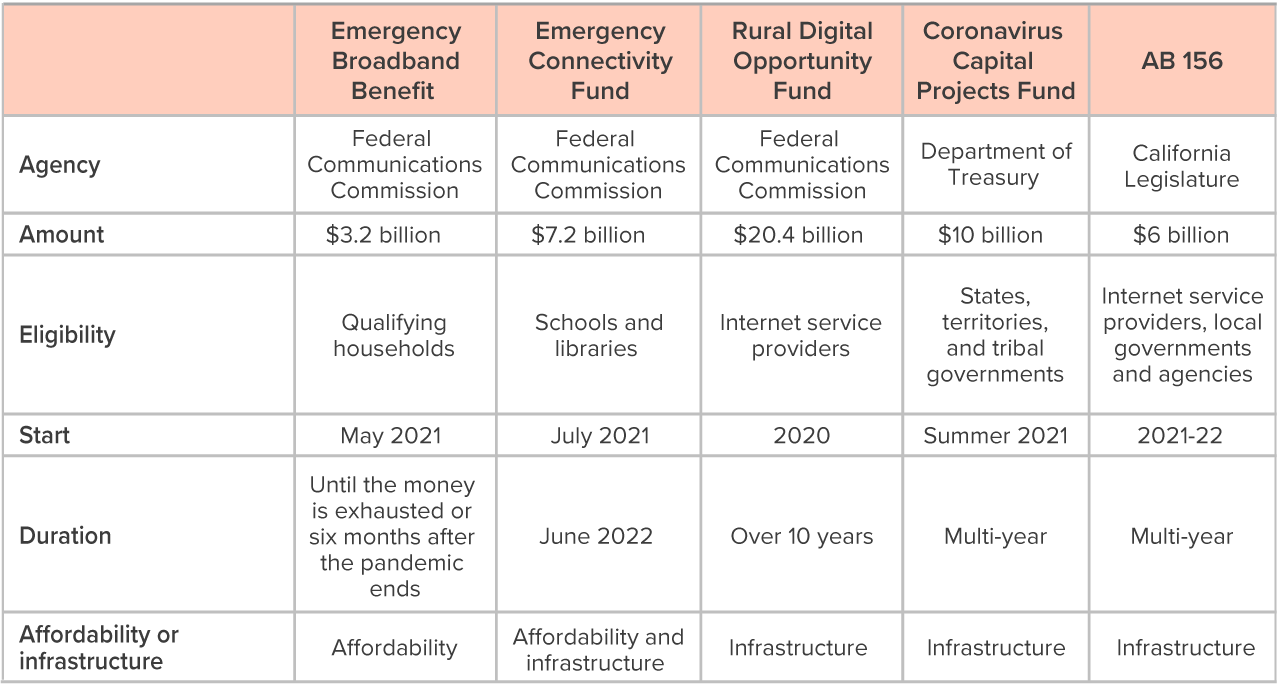
SOURCES: FCC 2021; Department of Treasury, 2021; California State Legislature, 2021.
NOTE: This table does not include the discretionary stimulus money that state and local governments can use for broadband programs among other things.
Lessons from Local Initiatives
As the state and local communities leverage these new investments to close digital equity gaps, we present different models that school districts and local entities across the state have deployed to create out-of-school or off-campus Wi-fi networks to serve students in their communities. These models provide compelling solutions that districts of various sizes and in various geographic locations can adopt to provide home access to students. Most of these districts began planning projects to address the digital divide prior to the pandemic. While there are other examples of more recent, COVID-inspired initiatives underway, we highlight these established programs as ones that are now well positioned to scale up or apply for emergency federal funding to accelerate implementation.
These efforts also share another element in common: a focus on providing connectivity to the broader community, not just to the students served in their particular jurisdiction. This wider lens may limit the initiatives’ eligibility for programs that stipulate a strict educational focus, but as the pandemic’s shift to distance learning has demonstrated, the distinction between resources used solely by students for educational purposes, and those used by other household members for other essential functions, may be an unhelpful one.
Imperial County Office of Education, BorderLink
The Imperial County Office of Education serves more than 35,000 K–12 students. Over 90 percent of students are Latino and nearly 80 percent are eligible for free or reduced-price lunch. In addition, nearly 40 percent of students are English Learners/emergent bilinguals. Two decades ago, the Imperial Valley Telecommunications Authority—a collaborative of 35 agencies including K–12 school districts, city governments, the Imperial County Office of Education, Imperial Community College, and San Diego State University—established a fiber optic network to provide network and internet services to over 120 educational and public agencies throughout the county. The county launched a pilot program in 2017–18 to create an off-campus LTE network to bring high-speed wireless connectivity to students in local school districts.
Fresno Unified School District, Private LTE Network
Fresno Unified is the third-largest district in California, serving more than 73,000 students. Nearly 90 percent of students are eligible for free or reduced-price lunch and about 70 percent are Latino. The district embarked on a Personalized Learning Initiative (PLI) in 2016 that leveraged technology and digital tools to deliver personalized, blended learning. Implementation of the initiative revealed the need for long-term off-campus digital access. The district’s early experience during distance learning also revealed significant variations in the quality and capacity of neighborhood networks. For example, cellular carriers have fewer cell towers in poorer neighborhoods. The district leveraged its fiber-optic backhaul and school buildings as platforms to deploy a private LTE service to students in the southern region of Fresno. During Phase I, the district deployed LTE at 15 school-facilities-as-towers covering about 20 square miles and supporting more than 6,500 concurrent student connections.
Lindsay Unified School District, Community Wi-fi Network
Lindsay Unified is a small, rural district serving about 4,000 students in Tulare County. Nearly all (95%) students are Latino, and 90 percent are eligible for free or reduced-price lunch. More than one in three students are English Learners/emergent bilinguals. The district’s Strategic Initiative emphasized the need for ubiquitous technology access outside of school hours: it makes maximum use of technology for learning, and all curriculum is online. After the district provided devices for students to access online curriculum, the district learned that as many as 60 percent of students did not have internet at home, and for those that were connected, the speed was too low (less than 1.5 mpbs) to support distance learning. Starting in 2012–13, the district built a community Wi-fi network to deliver high-speed internet to students at home. The district’s community Wi-fi network relies on a private LTE and an unlicensed 5GHz Spectrum, and the district is currently building out a Citizens Broadband Radio Service (CBRS) to cover densely populated areas that cannot be reached with 5G or enough LTE density.
Ventura County Office of Education, VCEDNET
Ventura County is home to more than 135,000 students, 60 percent of whom are Latino. The Ventura County Education Network (VCEDNET) is a federally registered internet service provider that delivers internet connectivity and hosted services to school districts, charter schools, and private schools in Ventura County. The network was conceived many years ago, and over time it has moved from dial-up to microwave to fiber. About 20 percent of the county’s population in the mountain areas are unconnected—the topographical challenges make it cost-prohibitive. The Ventura County Office of Education is having ongoing conversations with the Broadband Consortium of the Pacific Coast to bring internet to those families, and the recent federal and state stimulus dollars provide additional resources for this effort.
Recommendations
The pandemic has shined a spotlight on the essential nature of digital connectivity for learning. Federal, state, and local efforts have led to considerable improvements in digital access for students, with especially strong progress in access to computing devices. However, three in ten households still lack access to either reliable internet or a device, and disparities along racial/ethnic and socioeconomic lines persist. The FCC’s Emergency Connectivity Fund supports schools in purchasing laptops and tablet computers to close the remaining device gaps. In addition, recent investments from the federal and state governments provide a unique opportunity to expand broadband infrastructure, increase broadband affordability, and close gaps in internet access. To ensure that current and future investments are allocated effectively, efficiently, and equitably, we offer the following recommendations:
Improve current efforts to produce granular, accurate, and reliable broadband mapping. Mapping and data are key to identifying existing gaps, allocating investment dollars, and ensuring that the funding achieves the goal of reliable broadband for all. Yet detailed data on how many and which students have access to reliable internet remains limited. The FCC uses its broadband maps to allocate billions of dollars in subsidies, but it relies on data supplied by internet service providers. Companies can report that a census block is served even if only one household has internet service, which leads to overstating access. Using multiple data sources, the National Telecommunications and Information Administration’s Indicators of Broadband Need revealed substantial gaps between what providers say they offer and the speeds consumers report using. At the state level, the California Public Utilities Commission’s broadband mapping has similar limitations. Following the Broadband DATA Act (2020), the FCC announced a broadband mapping task force to improve its data collection and mapping tools. Governor Newsom signed an executive order in 2020 to direct state agencies to improve their mapping and data efforts as well. Partnerships with public agencies and private companies will be critical to producing granular, accurate, and reliable broadband mapping. Nearly all districts have purchased devices for students, and schools could play an important role in collecting data on actual usage and speed. For example, the state can develop a speed-test application that schools may run on their devices.
Provide annual reports on student access to the internet. The continued reliance on internet for teaching and learning calls for reliable data to guide ongoing state and local efforts. Nationwide, two in ten districts have adopted or plan to adopt a virtual option, and more than 80 percent of the largest 200 districts had some kind of virtual offerings in fall 2021 (Schwartz et al. 2020; Burbio 2021). In many districts, the digital tools and platforms that teachers relied on during distance learning, like Google Classroom, will continue to be used as we emerge from the pandemic (St George et al. 2021). The state can direct schools and districts to report broadband access—both in school and at home—as part of its data collection efforts. For example, such information could be included in Local Control Accountability Plans or School Accountability Report Cards.
Assess the need for continued subsidies. Nearly 40 percent of low-income students still lack reliable access to the internet. Recent legislation, including the Emergency Broadband Benefit and the Emergency Connectivity Fund, provided much-needed relief; however, these programs are temporary, and it is not clear whether low-income families will continue to access broadband after the subsidies expire. Congress is currently discussing an infrastructure package that could extend the temporary programs. The average broadband cost is $68 per month in the US, which is higher than in most OECD countries (New America 2020). If and when federal subsidies expire, the state should commission a study to examine how existing subsidy programs have been implemented, assess the need for continued subsidies, and develop recommendations for the best path forward (e.g., should the subsidy programs continue after the Emergency Broadband Benefit and the Emergency Connectivity Fund expire? Should the state increase the benefits for its existing subsidy program?).
Coordinated efforts among federal, state, and local stakeholders will be key. Even before the pandemic, many local communities across the state had taken up the task of bridging the digital divide. Therefore, they are now ready to capitalize on recent federal and state investments to scale up and sustain their programs in the long run. To leverage the experience and knowledge developed in these local efforts, the state and the philanthropic community could conceive of an innovation network to amplify these programs so that they can be scaled up to serve larger populations across the state. Implementation and coordinated efforts among various stakeholders—including service providers, municipalities, public and private agencies, philanthropies, and community organizations—will be necessary to leverage federal and state funding, scale up effective innovations, and expand broadband infrastructure.
The importance of digital connectivity to student learning is more apparent than ever. While unprecedented investments in broadband affordability and infrastructure during the pandemic contributed to sizable improvements in digital access for California students, progress appears to have stalled and deep equity gaps remain, particularly for low-income households. Much more work needs to be done to ensure that all students have reliable digital access that allows them to fully participate in their education.
Topics
COVID-19 K–12 Education PopulationLearn More

After COVID, Community Colleges Must Focus on Improving Online Courses

Building a Community-Owned Broadband Network in Imperial County

California’s Digital Divide

How Has California Narrowed Its K–12 Digital Divide?

The Digital Divide in Education