- Water in California is shared across three main sectors.
Statewide, average water use is roughly 50% environmental, 40% agricultural, and 10% urban, although the percentage of water use by sector varies dramatically across regions and between wet and dry years. Some of the water used by each of these sectors returns to rivers and groundwater basins where it can be used again. - Environmental water provides multiple benefits.
Environmental water use falls into four categories: water in rivers protected as “wild and scenic” under federal and state laws, water required for maintaining habitat within streams, water that supports wetlands within wildlife preserves, and water needed to maintain water quality for agricultural and urban use. Half of California’s environmental water use occurs in rivers along the state’s north coast. These waters are largely isolated from major agricultural and urban areas, and their wild and scenic status protects them from significant future development. In dry years, the share of water that goes to the environment decreases dramatically as flows diminish in rivers and streams. At the height of the 2012‒16 drought, the state also reduced water allocations for the environment to reserve some supplies for farms and cities.
Water use varies dramatically across regions and between wet and dry years
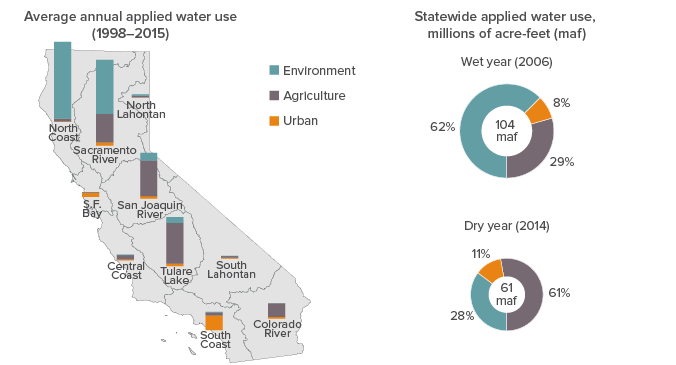
SOURCE: Department of Water Resources, California Water Plan Update 2018 (Public Review Draft).
NOTES: The figure shows applied water use. The statewide average for 1998‒2015 was 77.2 maf. Environment (38.3 maf average) includes water for “wild and scenic” rivers, required Delta outflow, instream flows, and managed wetlands. Urban (7.9 maf) includes residential, commercial, and industrial uses; and large landscapes. Agriculture (31 maf) includes water for crop production. Net water use—i.e., the volume consumed by people or plants, embodied in manufactured goods, evaporated, or discharged to saline waters—is lower. The figure excludes water used to actively recharge groundwater basins (3% for urban and 1% for agriculture on average), conveyance losses (3% for urban and 8% for agriculture), and water used for energy production (less than 2% of urban use).
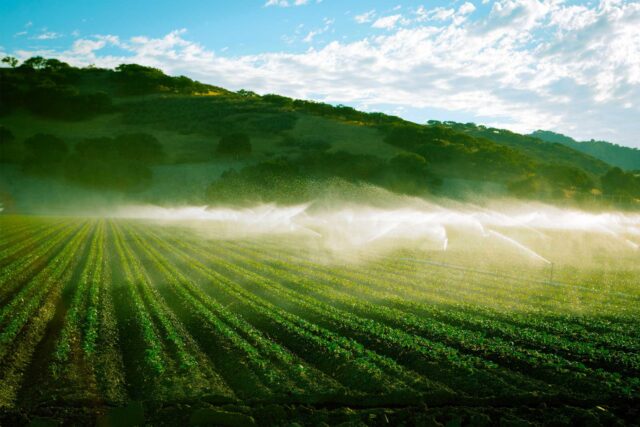
- Agricultural water use is falling, while the economic value of farm production is growing.
More than nine million acres of farmland in California are irrigated, representing roughly 80% of all water used for businesses and homes. Higher-revenue perennial crops—nuts, grapes, and other fruit—have increased as a share of irrigated acreage (from 16% in 1980 to 33% in 2015 statewide, and from 21% to 45% in the southern Central Valley). This shift, plus rising crop yields, has increased the economic return on water used for agriculture. Farm production generated 38% more gross state product in 2015 than in 1980, even though farm water use was about 14% lower. But even as the agricultural economy is growing, the rest of the economy is growing faster. Today, farm production and food processing generate about 2% of California’s gross state product, down from about 5% in the early 1960s. - Despite population growth, total urban water use has also fallen.
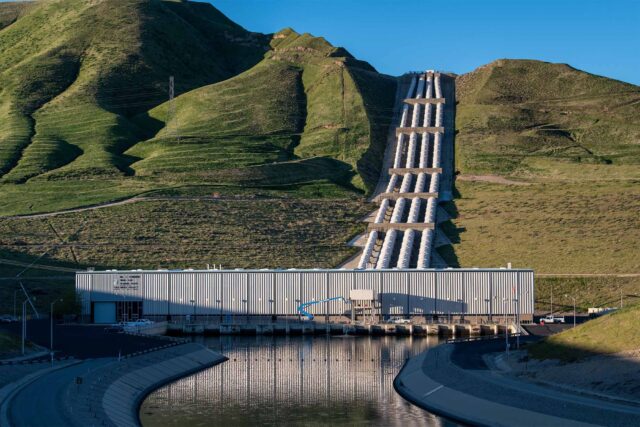
The San Francisco Bay and South Coast regions account for most urban water use in California. Both rely heavily on water imported from other parts of the state. Total urban water use has been falling even as the population grows. Even before the latest drought, per capita water use had declined significantly—from 231 gallons per day in 1990 to 180 gallons per day in 2010—reflecting substantial efforts to reduce water use through pricing incentives and mandatory installation of water-saving technologies like low-flow toilets and shower heads. In 2015, per capita use fell to 146 gallons per day in response to drought-related conservation requirements. Much of the recent savings came from reducing landscape watering, which makes up roughly half of all urban water use. Per capita use has since rebounded slightly, but a new state law will require further long-term reductions.
Both agricultural and urban water use have fallen over the past two decades
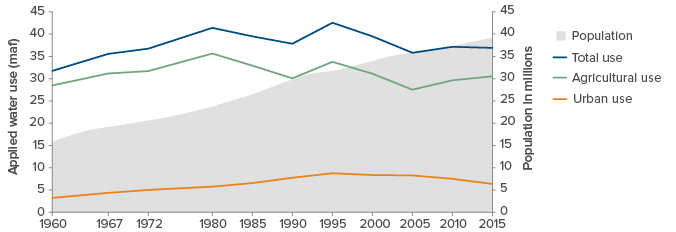
SOURCES: Water use: California Water Plan Updates (Department of Water Resources, various years). Population: Department of Finance.
NOTES: Except for 2015 (a severe drought year), the figure reports estimates for normal rainfall years. Pre-2000 estimates are adjusted to levels that would have been used in a year of normal rainfall. Estimates are for water years (October to September).
- Drought will pose major water use challenges.
California needs to adapt to increasing drought intensity. Agriculture relies heavily on groundwater during droughts—particularly in the Central Valley—but more sustainable groundwater management is needed to maintain this key drought reserve. An increase in tree and vine crops—which need to be watered every year—is making farming more vulnerable to water shortages. State law now requires water users to bring their groundwater basins into long-term balance by the early 2040s. This will likely require farm water use to fall in regions that have been over-pumping, including the southern Central Valley and the Central Coast. In urban areas, the greatest potential for further water savings lies in long-term reductions in landscape irrigation—a shift requiring changes in plantings and watering habits. Finally, state and federal regulators will need new approaches to reduce harm to fish and wildlife during increasingly intense droughts. This will require better drought planning, investments in new habitat, and setting aside water during wet years for ecosystem uses in dry years.