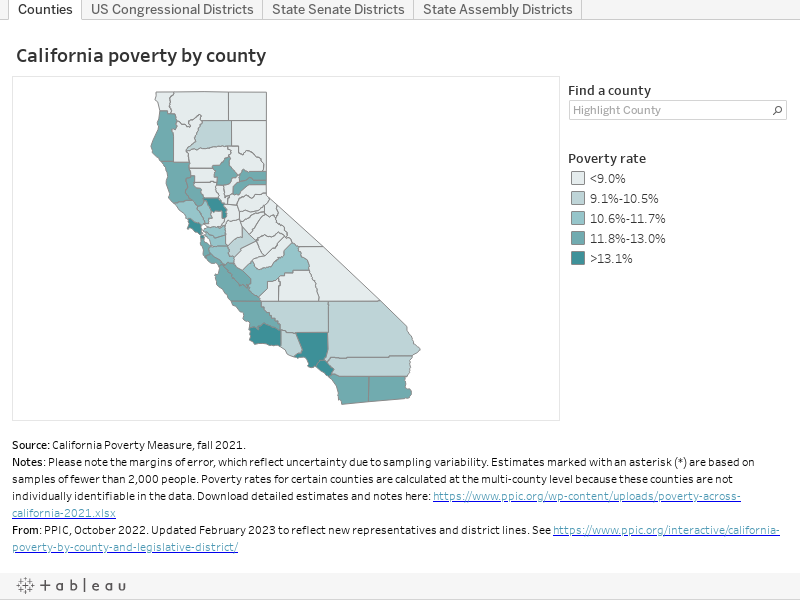
California Poverty by County and Legislative District
These interactive maps show fall 2021 average poverty rates for counties, congressional districts, state senate districts, and state assembly districts, according to the California Poverty Measure (CPM). The CPM is a joint research effort between PPIC and the Stanford Center on Poverty and Inequality that, unlike the official poverty measure, takes into account the cost of living and resources from social safety net programs. See Poverty in California: Technical Appendix A for adapted methods used in the fall 2021 CPM as compared to earlier years.
For more information or questions, please contact Caroline Danielson, Patricia Malagon, and Sarah Bohn.
This research was supported with funding from Sunlight Giving.
Related Content
Fact Sheet
Poverty in California
Poverty in California, Technical Appendix
Interactive
Who’s in Poverty in California?