
- Realignment shrank the parole population …
The number of parolees under active supervision—that is, those whose whereabouts are known and are not facing revocation for violating the terms of parole—began declining from a peak of 126,000 in 2007; by the beginning of public safety realignment in October 2011, the parole population totaled about 91,000. In its first year, realignment brought the number down to 61,000 by transferring supervisory responsibility for many offenders to the counties and requiring parolees to serve revocations in county jails rather than prison. The population reached a low of 42,400 as Proposition 47 became law in November 2014, before rising slightly and then plateauing; as of December 2017 the population was 46,000. - … but not as quickly as anticipated.
In 2012, the California Department of Corrections and Rehabilitation (CDCR) projected that the active parole population would drop to about 29,000 by 2015; in reality, it fell to approximately 45,500. It has never been easy to predict future parole caseloads, and projections have been further complicated by Proposition 47, which requires felons resentenced to misdemeanors to serve one year on parole, as well as Proposition 57 (2016), which allows offenders who exhibit good behavior to move more quickly from prison to parole. - The number of “at large” parolees—whose whereabouts are unknown—has decreased.
The number of parolees who are “at large,” and are therefore not being effectively supervised by the state, has declined. Immediately prior to realignment, slightly more than 11,000 parolees—11% of the parole population—were at large; as of December 2017, that number had fallen to 4,300—8.6% of the population.
Realignment sharply reduced the active parole population; at-large parole numbers have also declined
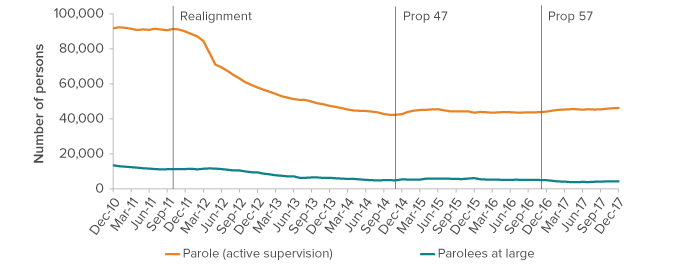
SOURCE: California Department of Corrections and Rehabilitation.
- African Americans remain overrepresented in the parole population.
At the end of 2016, African Americans made up 26% of parolees but only 6% of California’s adult population. Whites also make up 26% of the parolee population but comprise a much larger share—41%—of the total adult population. Latinos account for 40% of parolees and 35% of California adults, while 7% of parolees—and 18% of the adult population—are persons of other races. Additionally, the parole population has continued to age: from 2012 to December 2016, the share of parolees over age 50 went from one-sixth to one-fifth. - Realignment has increased the number of serious offenders supervised by parole.
Under realignment, only the most serious offenders are incarcerated in state prison and released to parole. This has shifted the type of offender supervised by parole. In 2012, 33% of parolees were under supervision for crimes against persons, while 29% had been sentenced for property crimes and 23% for drug crimes. By the end of 2016, 65% of parolees had been convicted of crimes against persons, while 16% had been sentenced for property crimes and 4% for drug crimes. - More parolees are receiving mental health services.
The number of parolees receiving mental health services increased from approximately 12,000 at the end of 2014 to 13,400 in 2016. Both the Correctional Clinical Case Management System, a program for offenders with relatively moderate mental health needs, and the Enhanced Outpatient Program, which provides more intensive care to offenders with acute mental disorders, had higher monthly caseloads during this period. - Counties absorb people released from CDCR at varying rates.
The number of ex-offenders returned to their communities from prison varies substantially across counties. In 2016, Marin had the lowest rate, 23 per 100,000 residents, while Kings received 270 per 100,000. The 10 counties with the lowest release rates received an average of 46 offenders per 100,000 while the 10 counties with the highest release rates received 220 offenders per 100,000.
Coastal counties tend to receive fewer offenders from CDCR
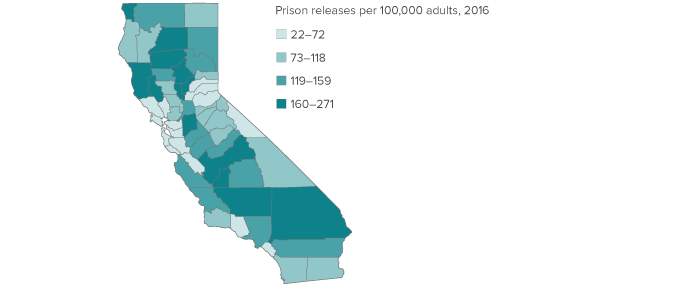
SOURCE: California Department of Corrections and Rehabilitation 2016; California Department of Finance 2016.
NOTES: Includes both parolees and offenders under post-release county supervision in 2016.
Sources: California Department of Corrections and Rehabilitation (prison and parole populations), California Department of Finance (California adult population).