-
- Arrests vary substantially across counties in California.
California’s arrest rate was 3,428 per 100,000 residents in 2016. However, smaller, rural counties tended to have higher arrest rates than larger, urban counties. Lake (7,906), Siskiyou (6,862), and Shasta (6,672) had the highest arrest rates in the state, more than double those of the counties with the lowest rates: Riverside (2,479), Santa Clara (2,576), and San Francisco (2,603). County variation in arrests could be driven by a range of factors, including crime rates, demographics, poverty, fiscal conditions, jail capacity, law enforcement staffing, and policing.
- Arrests vary substantially across counties in California.
Larger, urban counties tend to have the lowest arrest rates in California
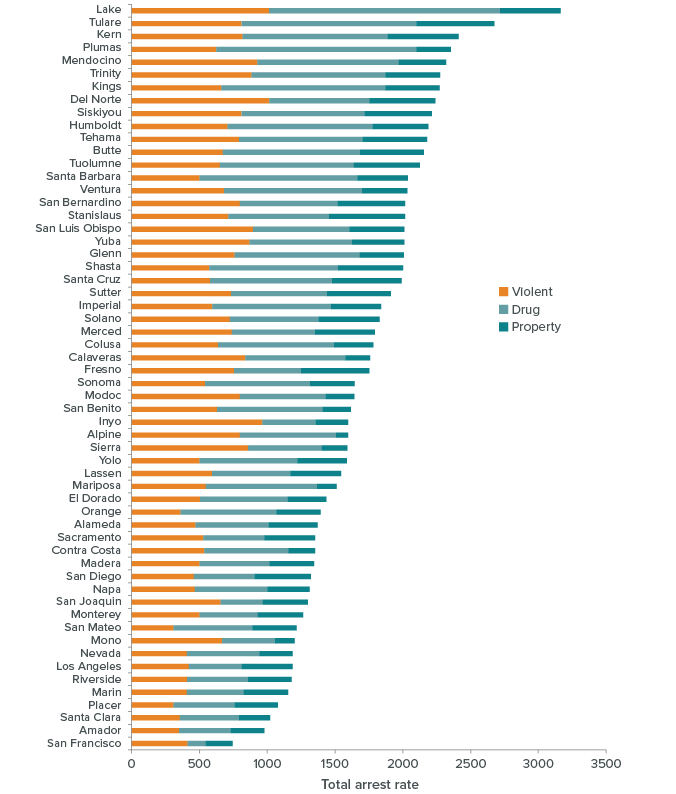
SOURCE: Authors’ calculations based on California Department of Justice’s Monthly Arrest and Citation Register and California Department of Finance Population Data, 2016.
NOTE: Arrest rates calculated per 100,000 residents.
-
- Drug arrests have increased in many counties.
Overall arrest rates in most counties have decreased markedly in the past few decades—but trends differ for various kinds of offenses. While arrest rates for property offenses have trended downward in all 58 counties, 30 counties saw rising arrest rates for drug offenses from 1989 to 2016. Statewide, the composition of drug arrests has changed as well: 42.9% of drug arrests were for misdemeanors in 1989, compared to 82.3% in 2016. Though most counties saw declining arrest rates for violent offenses, 13 counties—mainly rural or smaller coastal counties—had higher arrest rates for violent offenses in 2016 than in 1989. - Larger, urban counties tend to have higher shares of property arrests.
Counties show considerable variation in their shares of arrests for offenses with high social costs, such as those involving violence, property, or drugs. Drug offenses accounted for 16.3% of all arrests in California in 2016, compared to 14.5% for violent offenses and 10.8% for property offenses. Property arrests constituted 14.1% of all arrests in Contra Costa, 13.4% in both Sacramento and Los Angeles, and 13.2% in Riverside. This is in sharp contrast to the much lower shares of property arrests in counties like Alpine (1.5%), Mariposa (3.8%), and Sierra (4.0%). Meanwhile, smaller counties had some of the highest and lowest proportions of arrests for violent offenses. Counties with the highest shares of arrests for violent offenses included Mono (23.5%), Inyo (21.5%), and San Joaquin (20.2%); counties with the lowest shares of arrests for violent offenses included Shasta (8.6%), Amador (8.8%), and San Mateo (9.4%). - Racial disparities in arrests persist across counties.
Statewide, racial disparities in arrests have narrowed since 1990, but gaps remain. In 2016, the arrest rate among African Americans was 3.1 times higher than the white arrest rate and the Latino arrest rate was 1.1 times higher than the white arrest rate. However, many counties had significantly larger disparities. In 2016, 33 counties had an African American arrest rate that was at least three times larger than the white arrest rate, and 13 counties had an African American arrest rate that was at least five times larger. Three counties had a Latino arrest rate that was at least twice the white arrest rate, but notably 26 counties had a Latino arrest rate that was lower than the white arrest rate.
- Drug arrests have increased in many counties.
Racial disparities in arrests vary substantially across counties
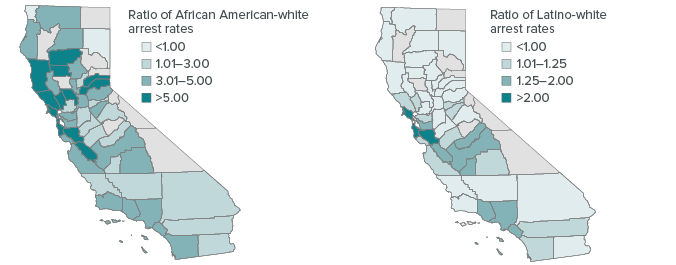
SOURCE: Authors’ calculations based on California Department of Justice’s Monthly Arrest and Citation Register and California Department of Finance Population Data, 2016.
NOTES: Maps show arrest rates per 100,000 residents in each of the relevant demographic groups, divided by arrest rates for whites. Data not shown for counties appearing in gray; these have fewer than 25,000 residents and detailed calculations by race/ethnicity are subject to wide fluctuation.
- Women are arrested at higher rates in smaller, rural counties.
Arrest rates for men and women have both fallen since 1980, but because men’s arrest rates have fallen more, the share of women among all arrestees has grown—from 13.4% in 1980 to 23.5% in 2016. The counties with the highest arrest rates for women in 2016 tended to be smaller, rural counties with high overall arrest rates, such as Tuolumne (4,210 female arrests per 100,000 female residents), Lake (4,130), and Siskiyou (3,824). These rates were roughly four times those in counties with the lowest arrest rates for women: San Francisco (982), Mono (1,046), and Santa Clara (1,142).
Related Content
Interactive: Arrests in California
Just the Facts: Arrests in California
New Insights into California Arrests: Trends Disparities, and County Differences