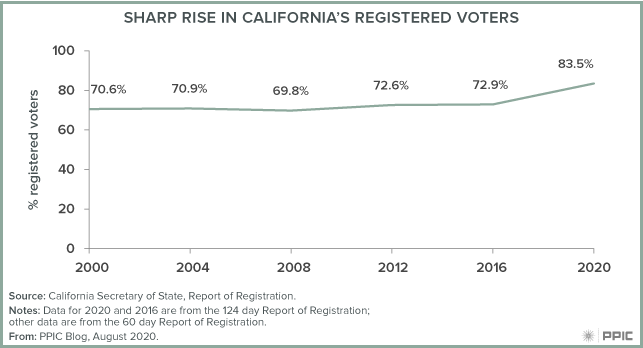
More Californians have registered to vote this year than in any other presidential election year for the last 20 years. In 2016, about 73% of eligible adults were registered to vote. This year, more than 83% were registered as of July, according to California’s secretary of state. That’s an increase of 2.8 million registered voters, and represents a significant jump in registration numbers since 2000.
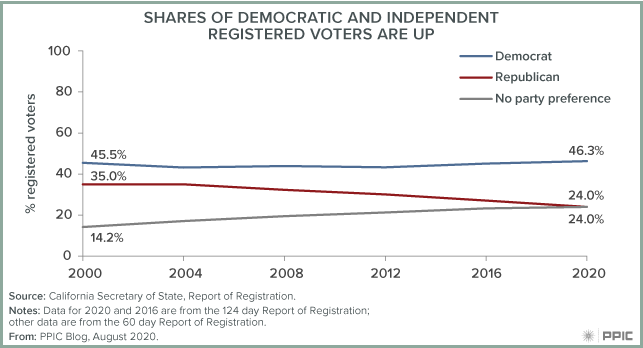
Today’s share of registered voters who are Democrats (46.3%) has increased since 2016 (45.1%), while the share of Republicans (24%) has declined (27.1% in 2016). At the same time, the share of independent voters (also known as “decline to state” or “no party preference”) is now 24%, up from 23.3% in 2016.
While the share of voters registering as Republican has declined, the party actually has 120,000 more voters now than at this point in 2016. Notably, in the lead up to the previous three presidential elections the total number of Republicans had declined even as the state’s population increased.
Meanwhile, in the last four years the Democratic party has gained 1.5 million registered voters and independent registered voters have grown by more than 800,0000.
The distribution of registered voters has shifted significantly by party over the last twenty years. The share of Republican registered voters has declined 11 points and the share of independent registered voters has increased 10 points. The Democratic share of registered voters has stayed about the same since 2000.
But trends in party registration tell just part of the story of California’s voters. Surprisingly, we have found that the ideological composition of the electorate has changed little over the last twenty years. Since 2000, we have asked Californians where they place themselves on the ideological spectrum, ranging from very liberal to very conservative. In general, Californians fall evenly across this spectrum, from liberal (34%) to moderate (33%) to conservative (33%). One change: in 2000, Californians were slightly more likely to identify as conservative (36%) than liberal (31%).
Across registration groups, independents—despite a sharp increase in registration numbers—have most consistently identified as moderate since 2000. About four in ten identify as moderate each year, compared to about three in ten saying they are liberal or conservative.
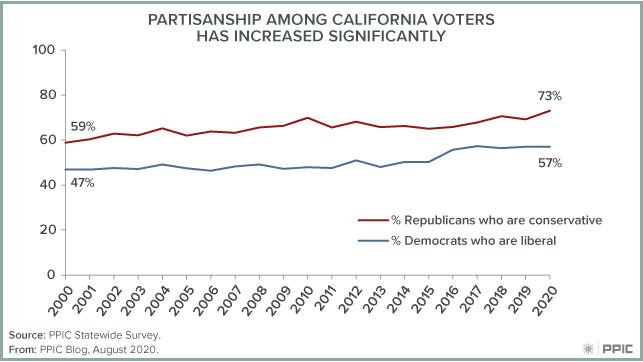
However, partisans have become much more polarized. Since 2000, we have seen double-digit increases in the share of Democrats who consider themselves liberal and the share of Republicans who consider themselves conservative. Notably, since 2016 there has been a 7-point increase in conservatism among Republicans, while liberalism among Democrats has remained unchanged.
The sharp increase in the share of Californians who are registered to vote could have a profound impact on the election in November. Further, California has a considerable share of registered voters who prefer not to align themselves with either party in terms of registration or ideology.
Stay tuned to the PPIC Statewide Survey as we continue to track partisanship and ideology among California’s voters—and monitor who is likely to cast a ballot in this historic election.